
Exchange: NSE
Type: Equity
Sector: Fmcg
Disclaimer: Nestle Analysis pages are for educational purposes only with delayed data. One should not make any investment decisions based on the data provided here.
Analysis for NESTLEIND
NESTLEIND Overview
NESTLEIND Analysis
NESTLEIND Market Chart
NESTLEIND Option Chain
NESTLEIND Open Interest
NESTLEIND Straddle Chain
NESTLEIND Option Snapshot
NESTLEIND Straddle & Strangle
NESTLEIND Max Pain
NESTLEIND Options Premium
NESTLEIND Cumulative OI Change
NESTLEIND Open Hight Open Low
NESTLEIND Put Call Ratio (PCR)
NESTLEIND Multistrike OI Analysis
NESTLEIND Strikewise Oi Analysis
NESTLEIND Intraday OI Breakup
NESTLEIND Trending OI
NESTLEIND Premium Change / Decay
NESTLEIND Cumulative Volume
NESTLEIND Trending Volume
NESTLEIND Straddle Chain
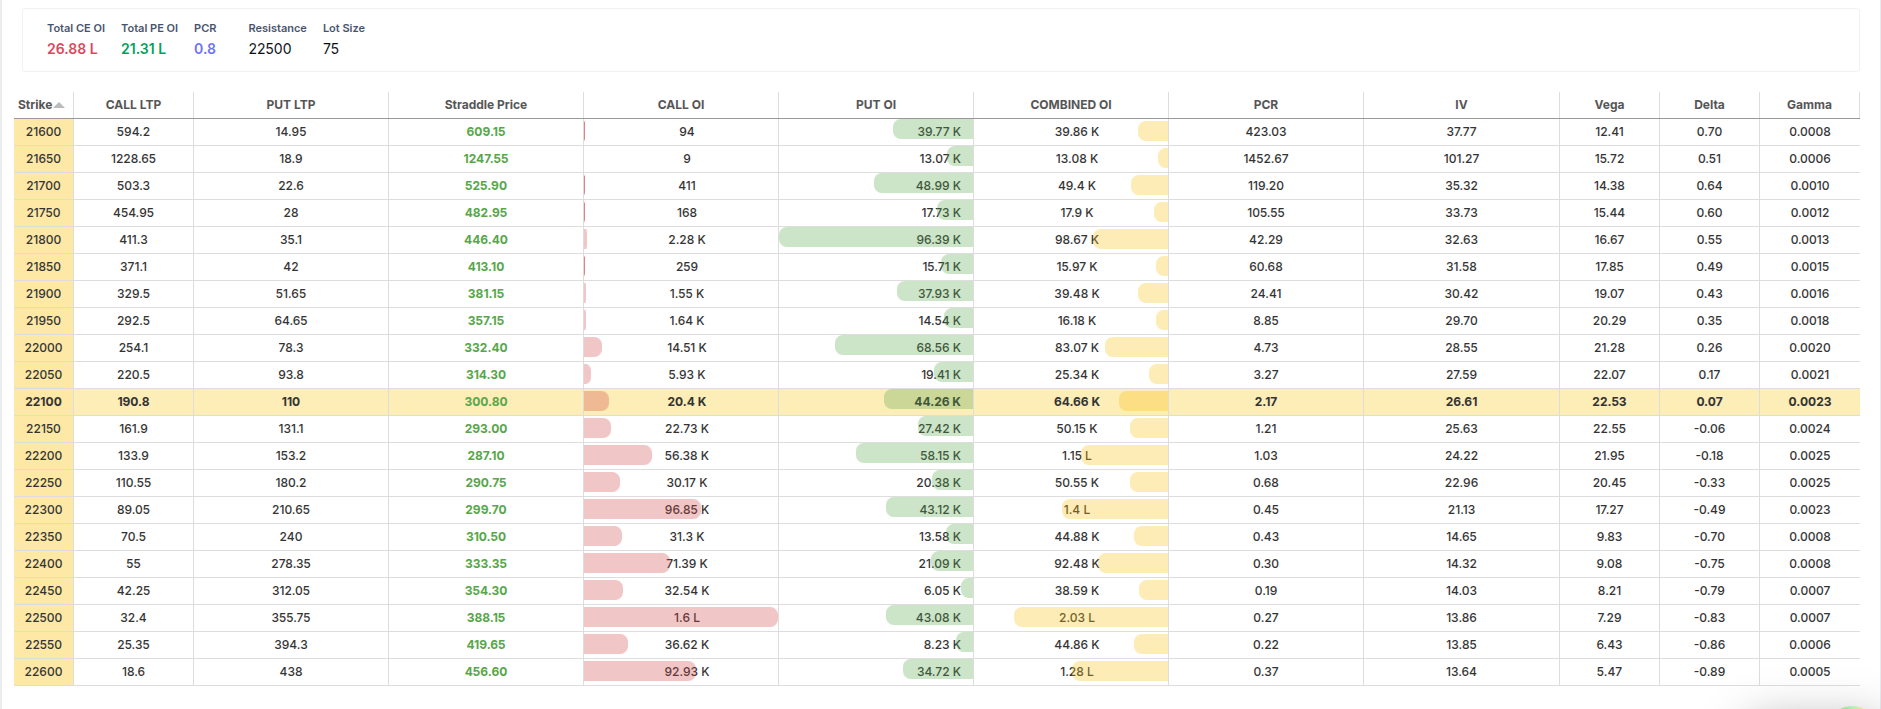
Explore Straddle Chain for NESTLEIND in Stolo
NESTLEIND Straddle Chain – Implied Move, Pricing & Breakeven Levels
The NESTLEIND straddle chain on Stolo helps traders understand how the options market is pricing future movement in NESTLEIND. A straddle combines a call and a put at the same strike and expiry, making it a pure volatility-focused position. This page is designed for traders who want to measure expected price movement, not just direction. By presenting straddle pricing, breakevens, and implied move data clearly, Stolo allows traders to assess whether the market is overpricing or underpricing risk in NESTLEIND.What Is a NESTLEIND Straddle?
A straddle is an options strategy that involves buying or selling both a call and a put at the same strike price and expiration date. The payoff depends on how much NESTLEIND moves, not whether it moves up or down. The NESTLEIND straddle chain on Stolo lists these combined positions across strikes and expiries, making it easy to compare pricing and expected movement in one view. This tool answers a critical question for traders: How much movement is the options market expecting from NESTLEIND?Why Traders Use the NESTLEIND Straddle Chain
Straddles are widely used around events, earnings, and periods of uncertainty. Traders turn to the NESTLEIND straddle chain on Stolo to evaluate whether implied expectations align with their own outlook. If the straddle price is high, the market expects significant movement. If the price is low, expectations are muted. Understanding this helps traders decide whether volatility is worth buying or selling in NESTLEIND. This page removes guesswork by showing implied expectations directly.Key Components of the NESTLEIND Straddle Chain on Stolo
NESTLEIND Straddle Pricing by Strike
Each row in the straddle chain represents a strike price, with the straddle premium calculated as the combined cost of the call and put at that strike. On Stolo, traders can quickly compare how straddle prices change as strikes move in-the-money or out-of-the-money. This comparison helps identify which strikes the market considers most sensitive for NESTLEIND. Pricing differences across strikes often reflect skew and positioning.NESTLEIND Implied Move Calculation
The implied move represents the expected price range the market is pricing into options until expiration. On Stolo, the implied move is derived from the straddle price and displayed clearly alongside each strike. For NESTLEIND, this value shows how far price would need to move for a straddle buyer to break even. Traders use this metric to compare market expectations against historical behavior or upcoming catalysts. This is one of the most valuable insights the straddle chain provides.NESTLEIND Breakeven Levels
Breakeven levels show the upper and lower price points where a straddle becomes profitable. On Stolo, these levels are calculated automatically for each strike and expiry. By reviewing breakevens, traders can visually understand the range NESTLEIND must trade within to benefit from buying or selling volatility. This helps in planning risk and reward clearly.How NESTLEIND Straddle Data Is Presented on Stolo
The NESTLEIND straddle chain on Stolo is structured for quick comparison. Traders can switch between expiries and instantly see how implied movement changes over time. Key elements include:- Combined straddle premium
- Implied move in points and percentage
- Upper and lower breakeven levels
- Liquidity indicators via underlying option data