Trader Voices
Why Smart Traders Choose Stolo?
Every trade is a small bet on a dream, backed by risk and a decision you have to own. Stolo is built for traders who bring purpose and discipline to that decision, not just numbers.
India’s Ultimate Multistrike OI Analysis Tool - Take your options trading to the next level with Stolo's Multistrike OI Analysis tool, offering comprehensive data and analysis for informed decision-making.
No credit card required · Trial Plan available · Setup in 3 minutes
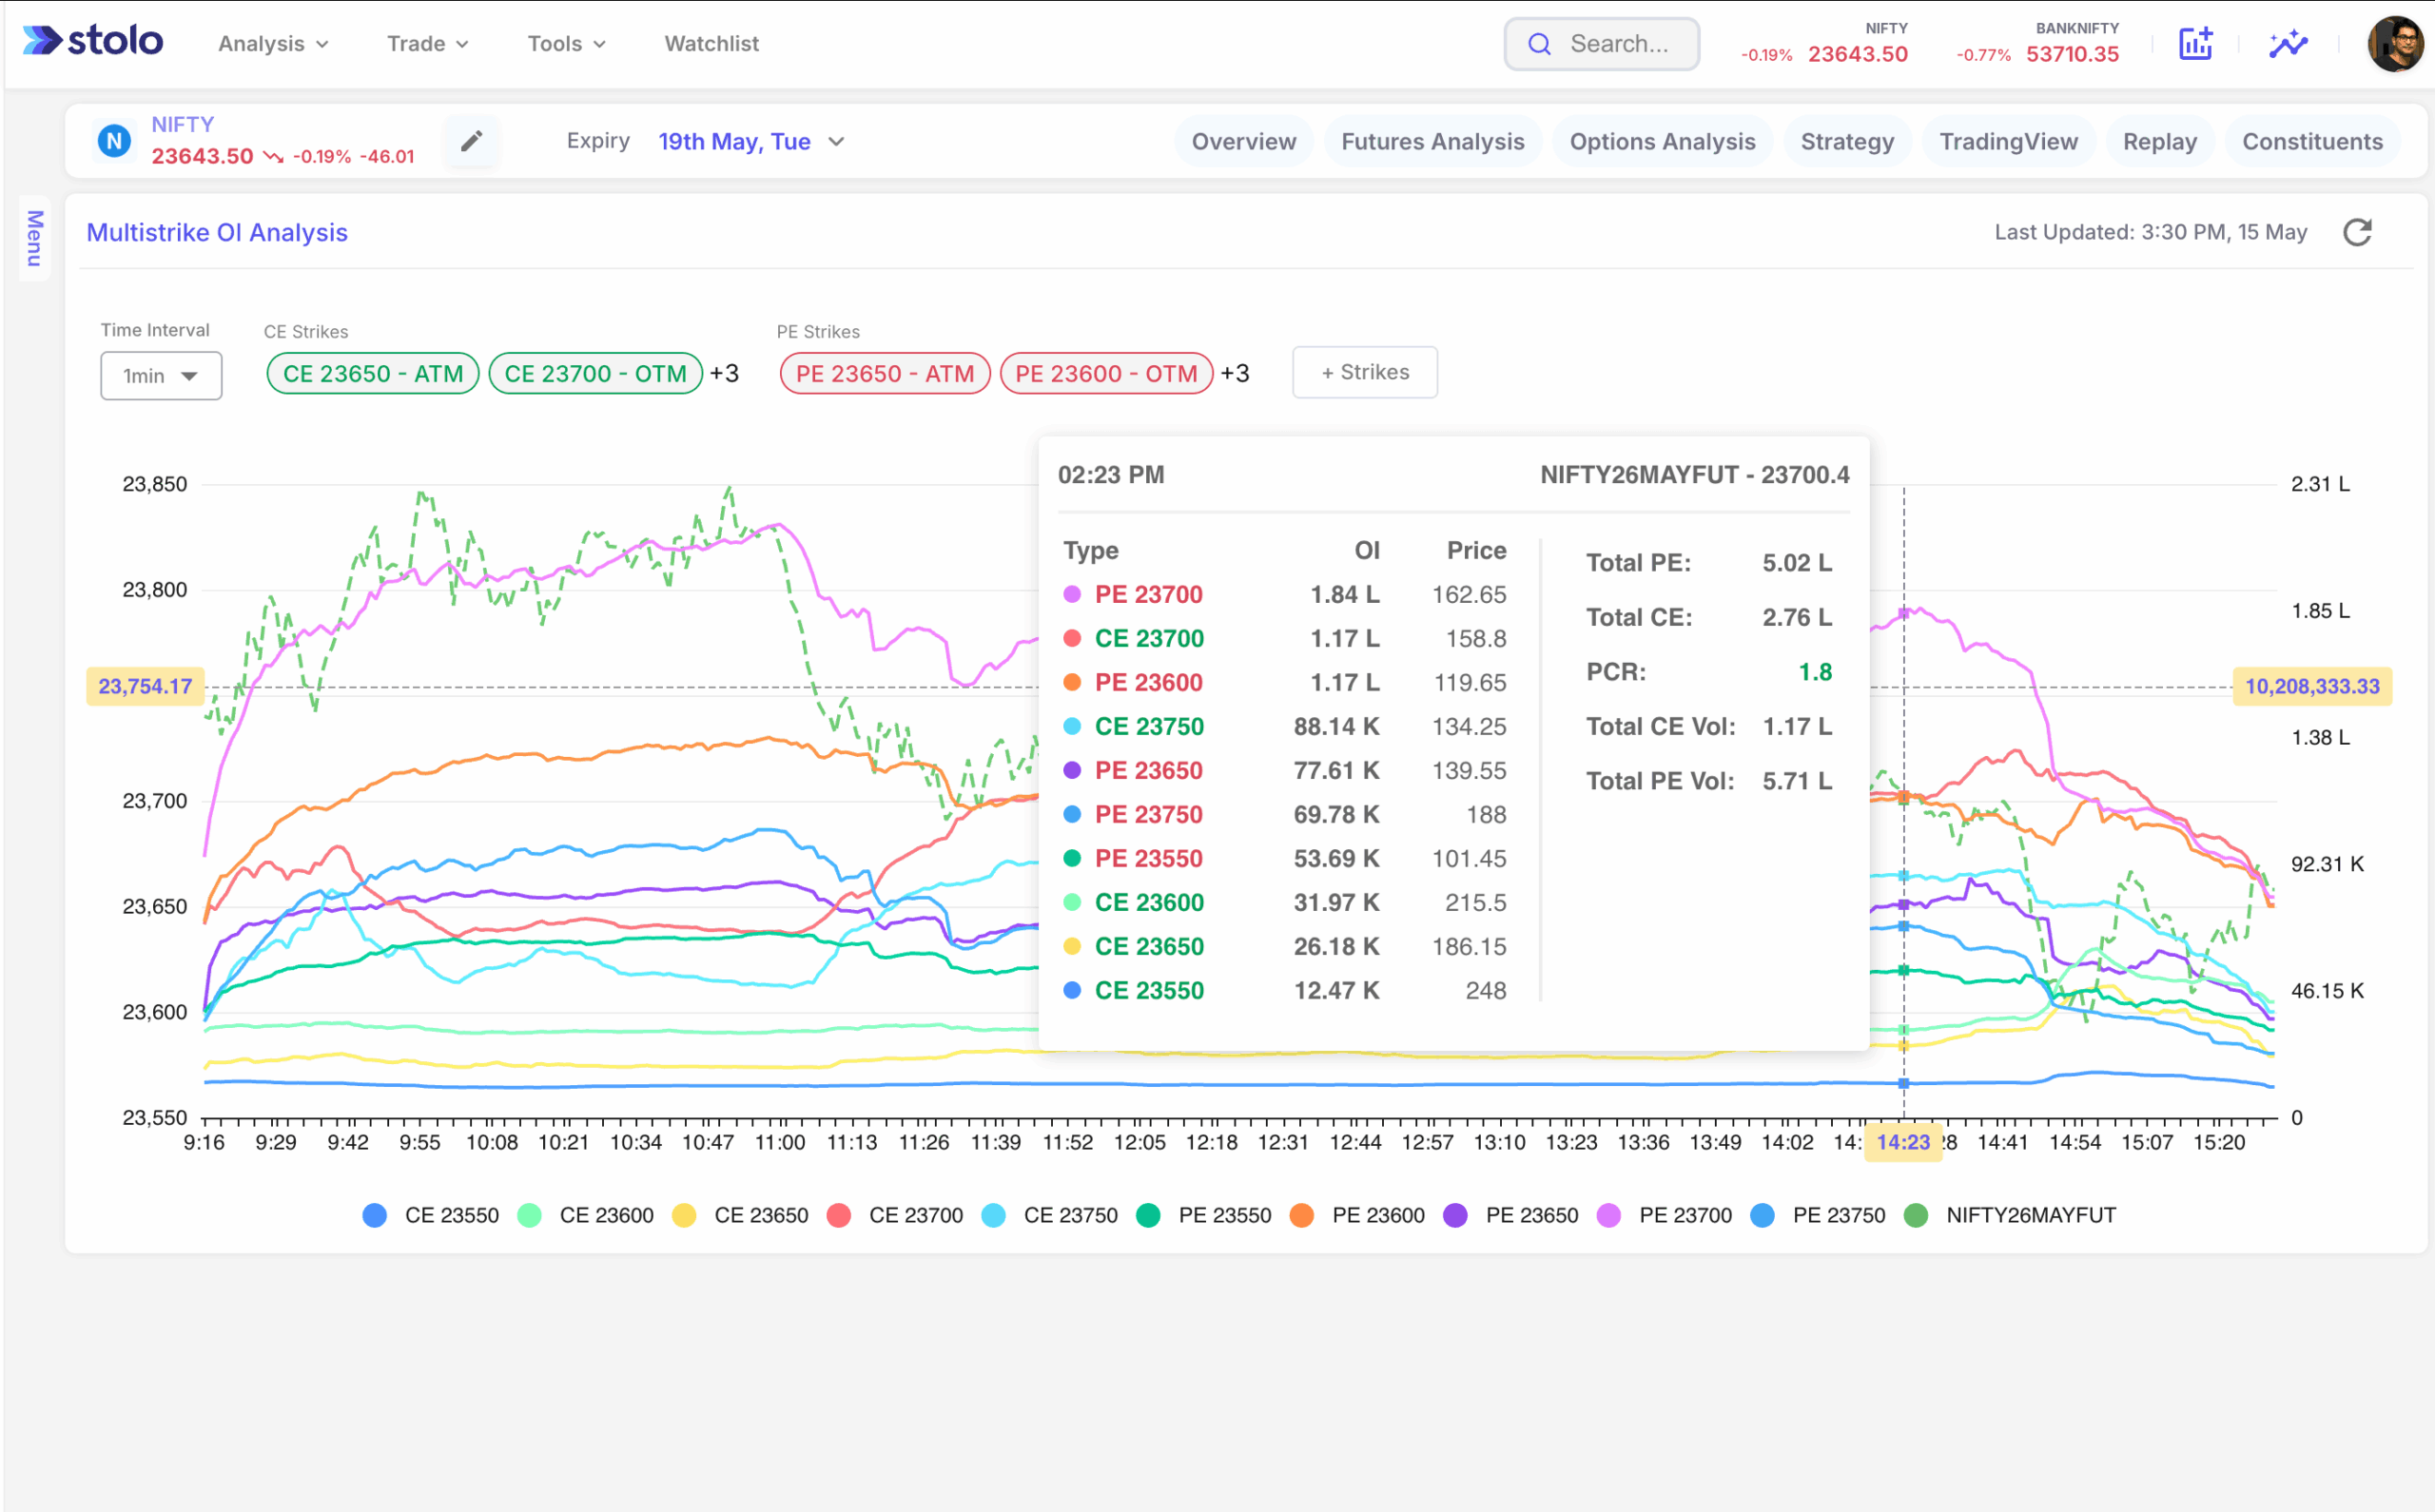
Options markets move on institutional positioning, yet most traders only watch a single strike at a time. That gap is what costs them trades they should have won.
Watch only the ATM strike and the OI walls sitting a few strikes away stay invisible. A resistance level three strikes out can stall a breakout you never saw building, and you're left holding a loss on a trade that had no business being placed.
The OI signal that predicted a breakout usually fires about ten minutes before the price chart confirms it. If you're only watching one strike, you're structurally always a step behind the move institutions already made.
Checking five strikes across two expiries means five tabs open, constant refreshing, and a picture that never quite comes together. Decision errors during intraday sessions usually trace straight back to exactly this kind of scramble.
A large OI unwind at a key strike is usually the first sign that a support or resistance level is about to give way. Miss it because you weren't watching multiple strikes live, and the signal is gone before you get a chance to act.
Multistrike open interest means tracking OI across several strike prices at once, so you can actually see where institutional money is sitting rather than guessing from one data point.
Open interest is the count of outstanding options contracts that haven't been closed or expired yet. It's cumulative: new contracts push it up, closed positions bring it down. A strike carrying heavy OI tells you real institutional capital is sitting there.
A single strike only tells you about one price level. Look across several and you get the story of the whole range: where writers are stacked up, where coverage thins out, and which levels institutions are actually defending. None of that shows up if you're staring at one number.
A strike loaded with Call OI tends to act as resistance, since writers there have reason to defend it. Heavy Put OI works the same way as support. Price often drifts toward these clusters before reversing or punching through, and multistrike OI puts these walls right in front of you.
The spread between Call OI and Put OI at each strike tells you whether positioning across the range leans bullish or bearish. Watch that balance live across up to 30 strikes and you're seeing the real conviction behind a move before the chart catches up to it.
Every feature here is aimed at the trader doing real analysis, not the one checking a number in passing.

Track live LTP, OI, OI change and volume across several strikes at once, on Nifty, BankNifty and FinNifty, without switching tabs or refreshing charts.

Pick up to 3 expiry dates, weekly, monthly or far month, and compare OI across them to see where institutions are rolling positions or placing longer-term bets.

Run the same multistrike OI analysis on any of the 191 NSE F&O stocks, not just indices. Spot accumulation, distribution or a range tightening up before you enter a position.

Select any 30 strikes above and below ATM for a wide view of how OI is distributed, useful when you need to understand the full range of institutional positioning for an expiry.

Watch OI build up and unwind live across whichever strikes you've selected. Charts keep refreshing through market hours, so you catch the move as it happens rather than reading about it later.

See absolute OI, OI change, Call vs Put OI and net OI across up to 30 strikes together, giving you the full read on where writers are concentrated and where price is likely headed.

Switch between Call (CE) and Put (PE) OI for any strike independently, so you can isolate writer positioning on either side and catch asymmetric risk before it ever shows up on the chart.

Overlay index price with multiple Call OI and Put OI lines on one chart, so you can see exactly how price is reacting to OI levels live, without hopping between windows.
Heavy open interest at a strike marks where the real fight is happening. Where Call writers cluster, you get resistance; where Put writers pile in, you get support. Stolo lets you view up to 30 strikes at once, so these walls are visible rather than buried in a table.
Instead of guessing levels from candlestick shapes, you're reading them straight off real-time institutional positioning, which gives your options strategies targets you can actually trust.
Try It Now

If you're running straddles, strangles or ratio spreads, watching OI shift at strikes away from ATM tells you when the market is likely to break a range, giving you room to adjust hedges ahead of the move rather than scrambling after it.
With 30 strikes on screen at once, you won't get caught wrong-footed by a big OI unwind in Nifty or BankNifty. The signal is there well before the price move; most traders just aren't set up to see it.
Start Your TrialPicking a strike on premium alone is probably the most common mistake in options trading. Multistrike OI shows you exactly which strikes carry the strongest writer interest, which usually means the market expects price to stay clear of them.
Sell near the strikes writers are defending. Buy where OI is thin and momentum is building. Stolo's real-time charts make this quick enough to act on before the setup disappears.
See It in Action
A proper pre-trade OI check takes under two minutes and noticeably sharpens your strike selection. Here's the routine serious traders run before every trade.
Start Your TrialPick your index, Nifty, BankNifty or FinNifty, or one of the 191 F&O stocks, then choose up to three expiry dates. For intraday trades, start with the nearest weekly. Add a monthly when you're looking at positional setups or working out rolling risk.
Select ATM plus 5 to 10 strikes on either side. On something wide-ranging like BankNifty during a volatile session, go a bit deeper. Stolo highlights ATM automatically, so your range starts correctly anchored without you doing the math.
Find the strike with the heaviest Call OI (your resistance wall) and the one with the heaviest Put OI (your support wall). Treat these as your reference range for the session, and watch closely whenever price approaches either one, since that's usually where a reversal or breakout takes shape.
Keep an eye on the OI change column as the session runs. A fast unwind at the Call wall usually means writers are losing conviction and a breakout could be forming. Stable OI at the Put wall while price tests it points to genuine support. Catching the signal while it's forming, rather than after the chart confirms it, is really where the edge is.
Before you execute, check your multistrike OI reading against Stolo's open interest analysis tool to see if the broader trend agrees with what the multistrike view is telling you. When both point the same direction, you've got a trade backed by more than one signal, and better odds it plays out the way you expect.
Tracking open interest across several strikes gives you a different, and more usable, read on the market than the tools most traders default to.
| Feature | Stolo Multi-Strike OI | Standard Option Chain | PCR Tool |
|---|---|---|---|
| Visual OI charts per strike | |||
| Custom strike selection (up to 30) | |||
| Real-time OI change tracking | |||
| Compare 3 expiry dates at once | |||
| CE & PE OI overlay on one chart | |||
| 191 NSE F&O stocks | |||
| NSE-authorised data feed | Varies by broker | Varies |
It's the quickest way to see institutional positioning across the full options range, not just at whatever single strike you happen to be watching.

One strike at a time gives you a fragment. Multistrike OI gives you up to 30 strikes, live CE and PE data, and real-time chart overlays together, so the whole options chain story is in front of you in one view instead of scattered across tabs.

Watching OI shift across strikes away from ATM in real time gives you an early warning when a large unwind at a key strike signals support or resistance is about to break, leaving you time to adjust stops, exit, or hedge before it hits your P&L.

Seeing OI clustering across several strikes at once makes good setups obvious: range-bound conditions for premium selling, OI wall breaks for directional trades, cross-strike divergences for spreads. Stolo puts all of it in front of you live.
Questions?
Direct answers to the most-searched questions about multistrike open interest and multi strike OI analysis
View up to 30 strikes simultaneously, Call & Put OI side by side, across Nifty, BankNifty, FinNifty and 191 F&O stocks, to pinpoint support & resistance levels and time your options trades with precision.
Trader Voices
Every trade is a small bet on a dream, backed by risk and a decision you have to own. Stolo is built for traders who bring purpose and discipline to that decision, not just numbers.

My first impression of your site, "K.I.S.S."..... Simple yet effective...uncluttered and has all the ingredients a trader actually needs not the nonsensical ones... great job
These are unedited testimonials from traders in our Telegram community. Photos shown are AI-generated and used for representation only.

You have something unique in your platform that has changed my trading. I have used Quantsapp earlier didn't find it useful. I have tried opstra, sensibull etc.
These are unedited testimonials from traders in our Telegram community. Photos shown are AI-generated and used for representation only.

Dear Sir, I am really impressed with the user interface and multiple other facilities for option traders.
These are unedited testimonials from traders in our Telegram community. Photos shown are AI-generated and used for representation only.
Got a question or a feature you wish existed? Drop it in our Telegram community, the Stolo team is right there reading every message.