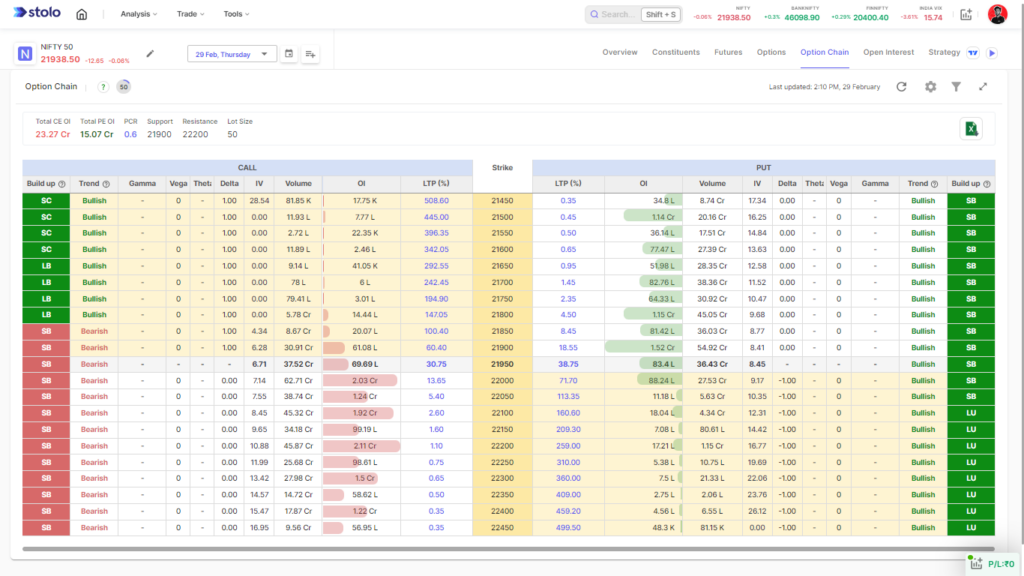
Before diving into key indicators to look for in an option chain, let’s start with a simple explanation of what an option chain is in options trading. An option chain, or the list displaying all available option contracts for a particular security, is a treasure trove of data waiting to be decoded. But what indicators within this plethora of information truly matter? Understanding these key indicators can demystify options trading and sharpen your decision-making process, potentially leading to higher success rates in your trades.
The Basics: Understanding an Option Chain
Before diving into the nuances of key indicators to look for in an option chain, it’s crucial to grasp the basics of an option chain. This is your comprehensive dashboard, showcasing various details such as strike prices, expiration dates, and whether options are calls or puts. It helps traders assess how different contracts are positioned in the market at any given moment. But within this information lies deeper insights. Identifying and interpreting these can set you on a path to more informed and, hopefully, more profitable trading decisions.

Key indicators to look for in an option chain?
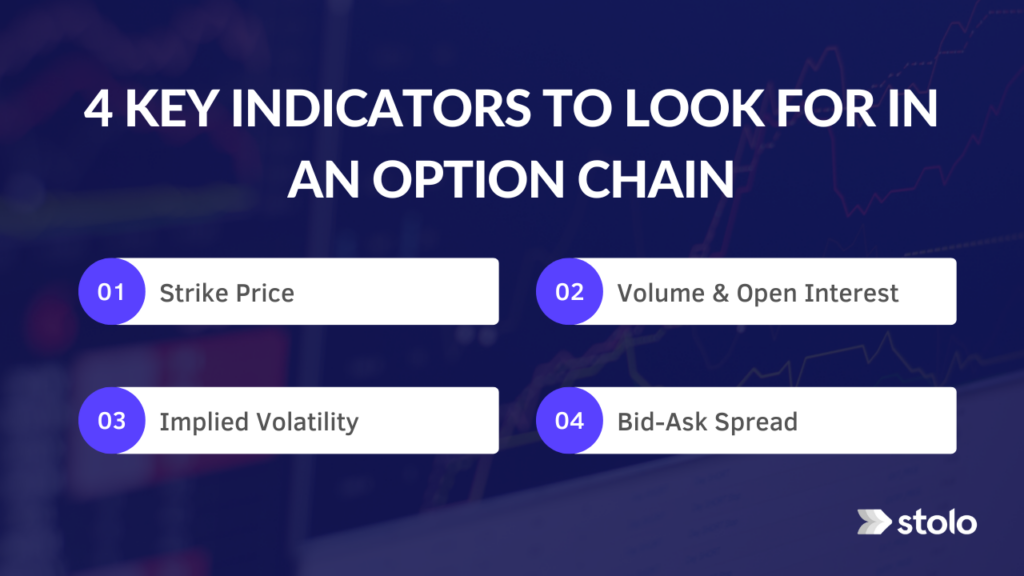
Here are the for 4 key indicators to look for in an option chain
- Strike Price
- Volume and Open Interest
- Implied Volatility
- Bid-Ask Spread

1 Strike Price: The Starting Line
The strike price is the agreed-upon price at which the option can be exercised. It’s akin to the starting line in a race, marking the spot from where progress (or the lack thereof) is measured. In the option chain, understanding how strike prices relate to the current market price of the underlying asset is fundamental. Options with strike prices close to the current market price are often more actively traded, indicating higher liquidity.
The Role of In-The-Money and Out-Of-The-Money
- In-The-Money (ITM): Options that have intrinsic value. For calls, this means the strike price is below the market price of the asset. For puts, it’s the opposite.
- Out-Of-The-Money (OTM): Options without intrinsic value. Call options with a strike price above the market price and put options with a strike price below are considered OTM.
Analyzing the distribution of ITM and OTM options in an option chain can provide insights into market sentiment. A preponderance of ITM call options may signal bullish trends, whereas dominance by ITM put options could suggest bearish outlooks.
2. Volume and Open Interest: Indicators of Market Activity
Volume and open interest are like the heartbeat and respiration rate of the options market, respectively — indicators of its living, dynamic nature.
- Volume: This represents the number of contracts traded within a day. High volume points to active interest and liquidity, suggesting a better environment for entering or exiting positions without substantial price impact.
- Open Interest: The total number of outstanding contracts that are held by market participants at the end of each trading day. Increasing open interest indicates new money coming into the market, which can signify strength behind current trends.
Analyzing these two metrics in tandem can offer powerful insights into market dynamics. A simultaneous increase in volume and open interest can reflect strong market conviction, whereas divergence might suggest a reevaluation phase among traders.
3. Implied Volatility: The Market’s Mood Ring
Implied Volatility (IV) is essentially the market’s prediction of a security’s potential to undergo significant price changes. Think of it as the financial market’s mood ring, offering a gauge of the underlying asset’s stability or turbulence as perceived by the market:
- High IV: Suggests expectations of substantial price swings, which can increase option premiums. This is often observed ahead of major announcements or economic events.
- Low IV: Indicates expectations of minor price movements, leading to lower option premiums. This can be seen in periods of market stability.
Understanding IV within the context of an option chain helps traders identify potentially undervalued or overvalued options. It’s a critical component in strategies aiming to capitalise on discrepancies between expected and actual market volatility.
4 Bid-Ask Spread: The Market’s Whisper
The bid-ask spread represents the difference between the highest price a buyer is willing to pay (bid) and the lowest price a seller is willing to accept (ask). It’s the market’s whisper, subtly indicating the liquidity and competitiveness of an option:
- Narrow Spread: Suggests high liquidity with keen buyer and seller interest. This environment facilitates easier entry and exit at preferable prices.
- Wide Spread: Indicates lower liquidity, possibly leading to difficulties when attempting to open or close positions. This can also hint at higher transaction costs.
Traders scrutinising the option chain for bid-ask spreads can better position themselves in negotiations, potentially saving on costs and improving trade outcomes.
Conclusion: The Art of Deconstruction
Decoding an option chain is no small feat, yet understanding its key indicators — strike price, volume and open interest, implied volatility, and the bid-ask spread — can significantly demystify the process. Consider these indicators as tools. Like any tool, their power lies not just in their existence but in the skill with which they are wielded. By dissecting an option chain through these lenses, traders can enhance their strategy, making more educated decisions founded on a deeper understanding of market dynamics.
As your journey in options trading continues, let these indicators guide you, but also remember that the market is an ever-evolving entity. Continuous learning, adaptability, and an analytical mindset are your true allies in navigating its currents. Happy trading, and may your decisions be informed and your trades prosperous! Stolo Options Trading Platform offers an advanced option chain analysis dashboard that will help you make informed trading decisions. Explore Stolo Option chain analysis for more.

