Trader Voices
Why Smart Traders Choose Stolo?
Every trade is a small bet on a dream, backed by risk and a decision you have to own. Stolo is built for traders who bring purpose and discipline to that decision, not just numbers.
Stolo's stock market screener filters all 218 NSE F&O stocks by Long Buildup, IV range, PCR, and sector - giving you an actionable shortlist before the market opens.
No credit card required · Trial Plan available · Setup in 3 minutes
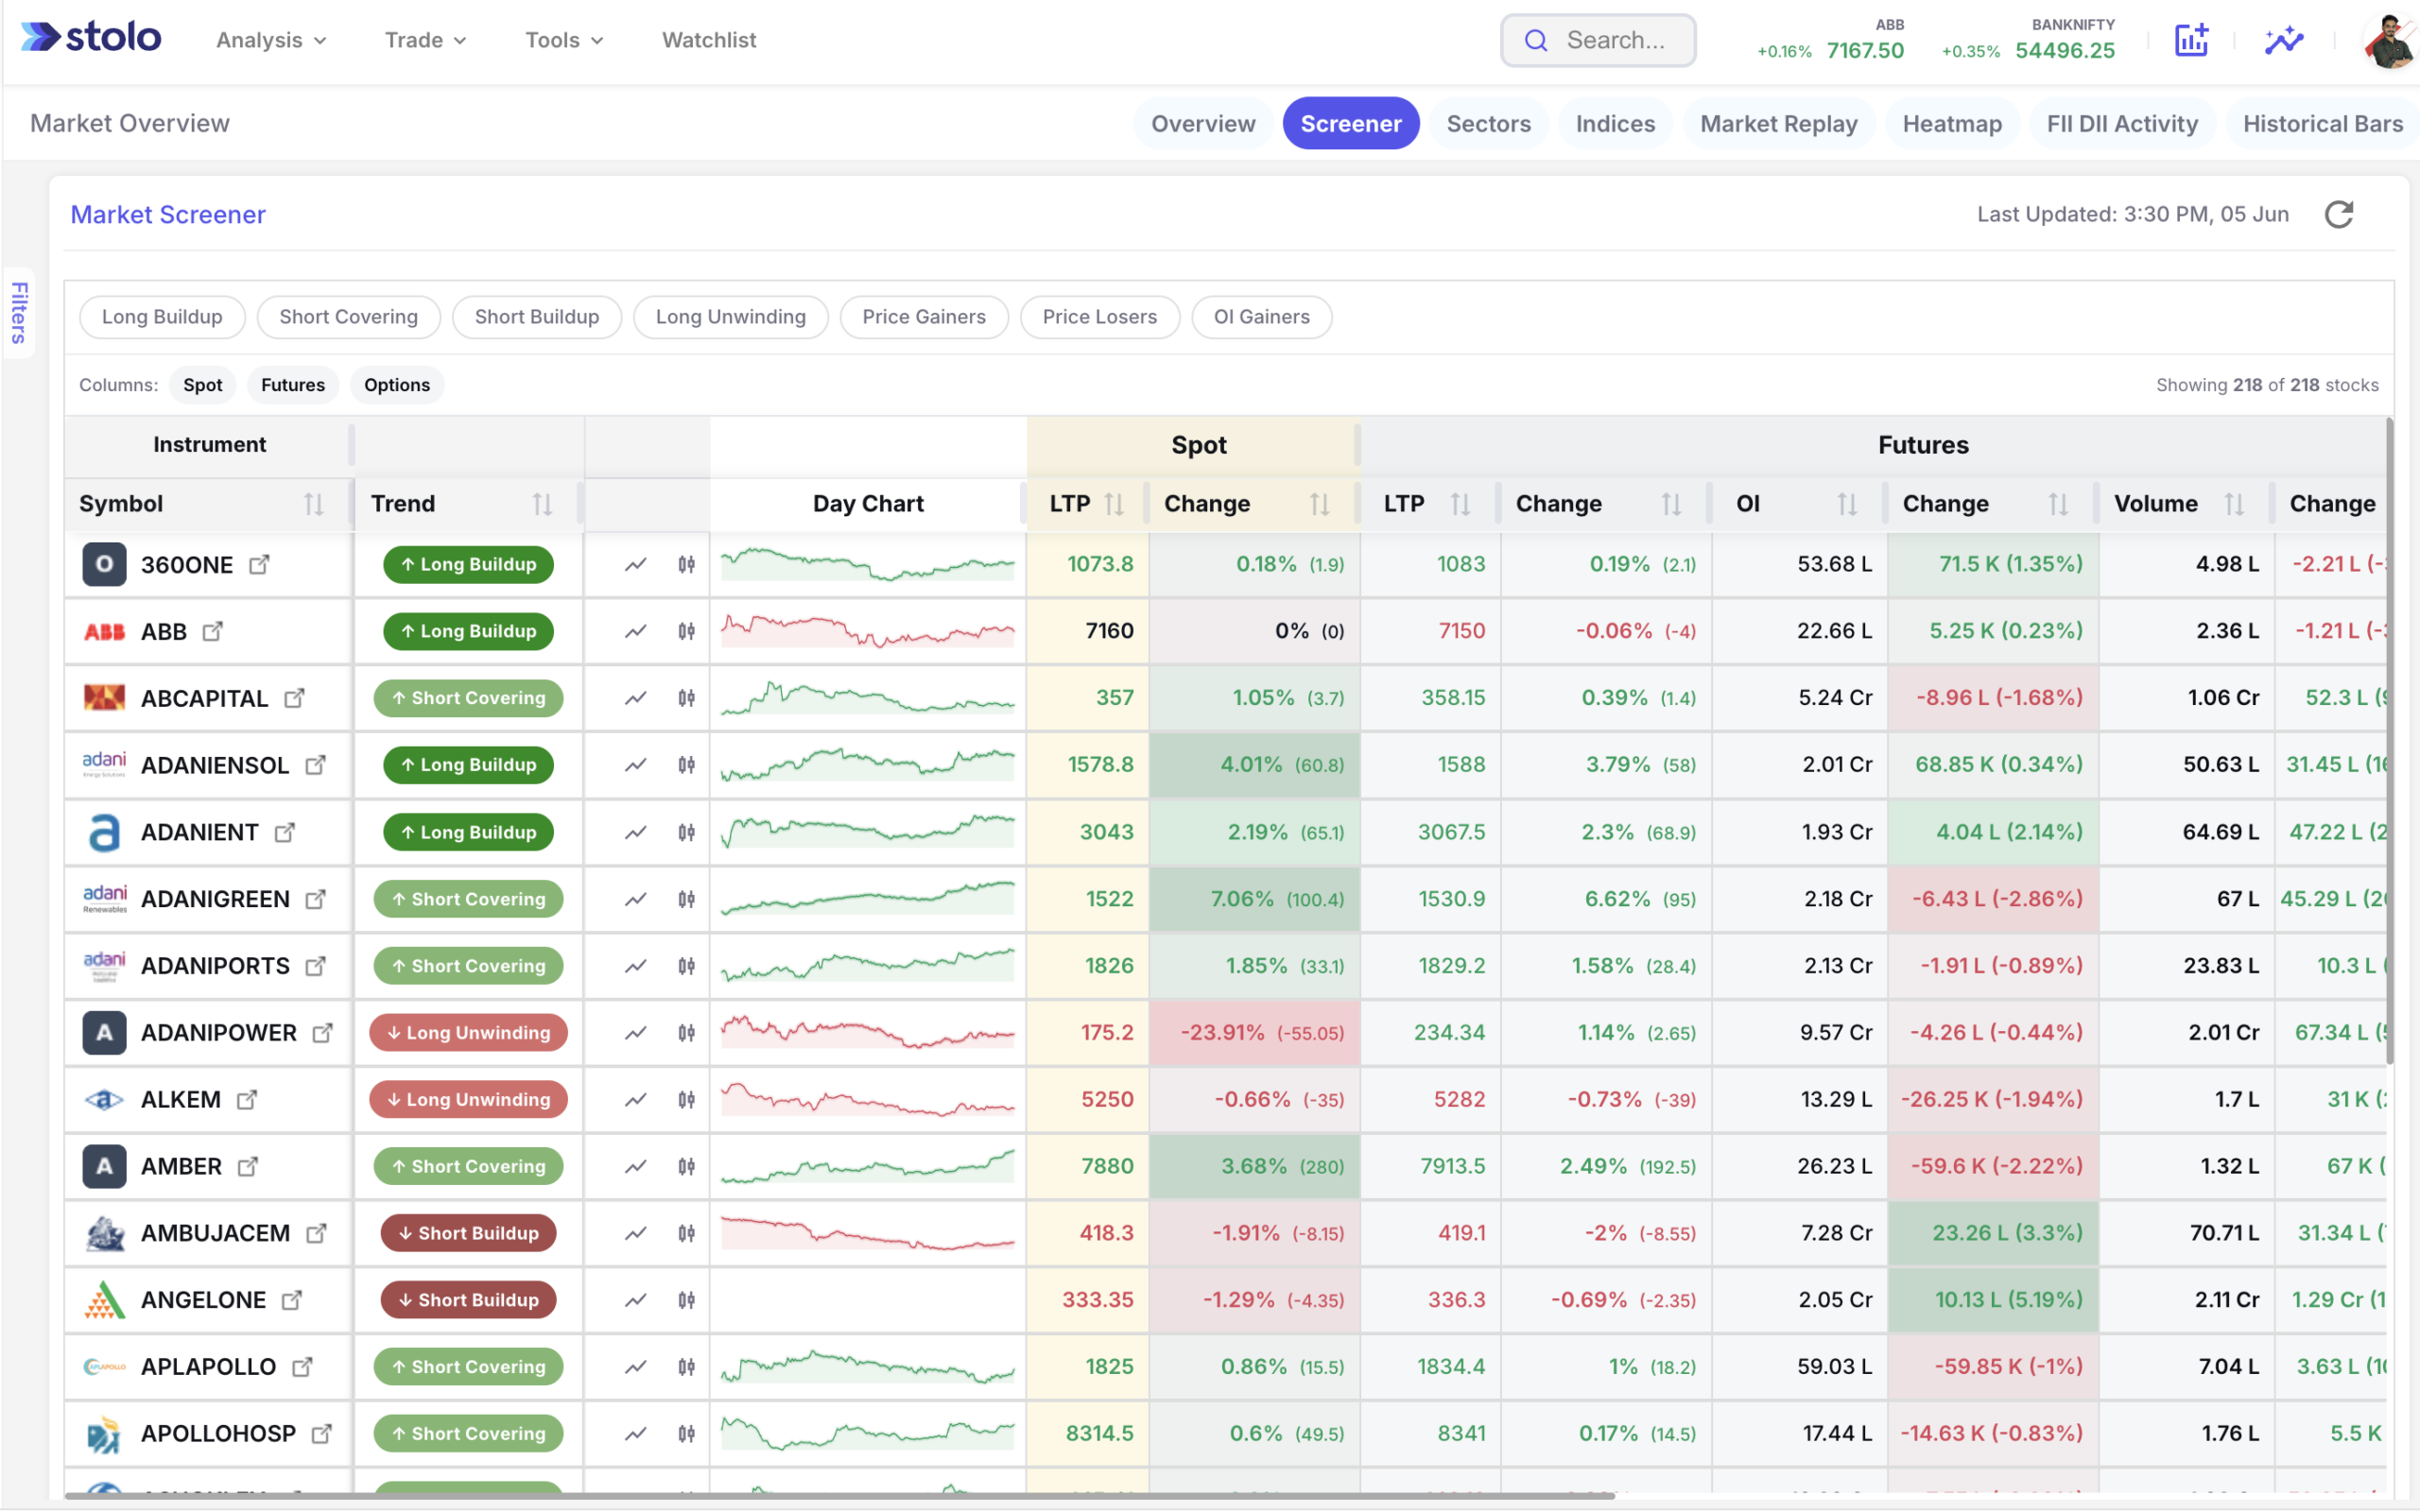
The NSE FNO segment has over 200 instruments. Without a structured market screener, a trader can burn the first hour of the session just trying to figure out which stocks are actually moving, and why.
Most tools show one stock at a time. Getting a market-wide picture means switching 20 tabs and losing context.
Stock screeners filter on price and volume. They miss OI buildup, IV range, and PCR entirely, which happen to be the signals that actually matter for F&O traders.
Manually scanning through sector by sector, stock by stock, is a 90-minute job. By the time you finish, the opportunity you were looking for is already gone.
Knowing that "long buildup is happening" somewhere in the market doesn't help much. You need to know exactly which stocks are seeing it, ranked, right now.
Spot price, futures OI, and options activity are never in one view. Connecting the dots across three different tools introduces lag and errors.
A market screener is a filter-and-rank engine that scans the entire NSE FNO segment, all 200+ stocks, and surfaces the ones meeting your specific trading criteria. Instead of watching individual stocks one by one, you ask the market a question: "Show me every stock with rising OI, increasing futures volume, and an IV below 30% right now."
What makes a screener FNO-specific rather than just a stock screener is the options data folded into the filters: implied volatility, put-call ratio, OI buildup patterns, futures change. A generic screener tells you a stock moved. This one also tells you why it moved, and whether that move is worth an options position at all.
Explore OI AnalysisSet custom ranges for IV, PCR, futures % change, and OI % change. The screener returns only the stocks that pass every filter simultaneously.
One click to isolate Long Buildup, Short Covering, Short Buildup, Long Unwinding, Price Gainers, or OI Gainers across all 200+ FNO stocks instantly.
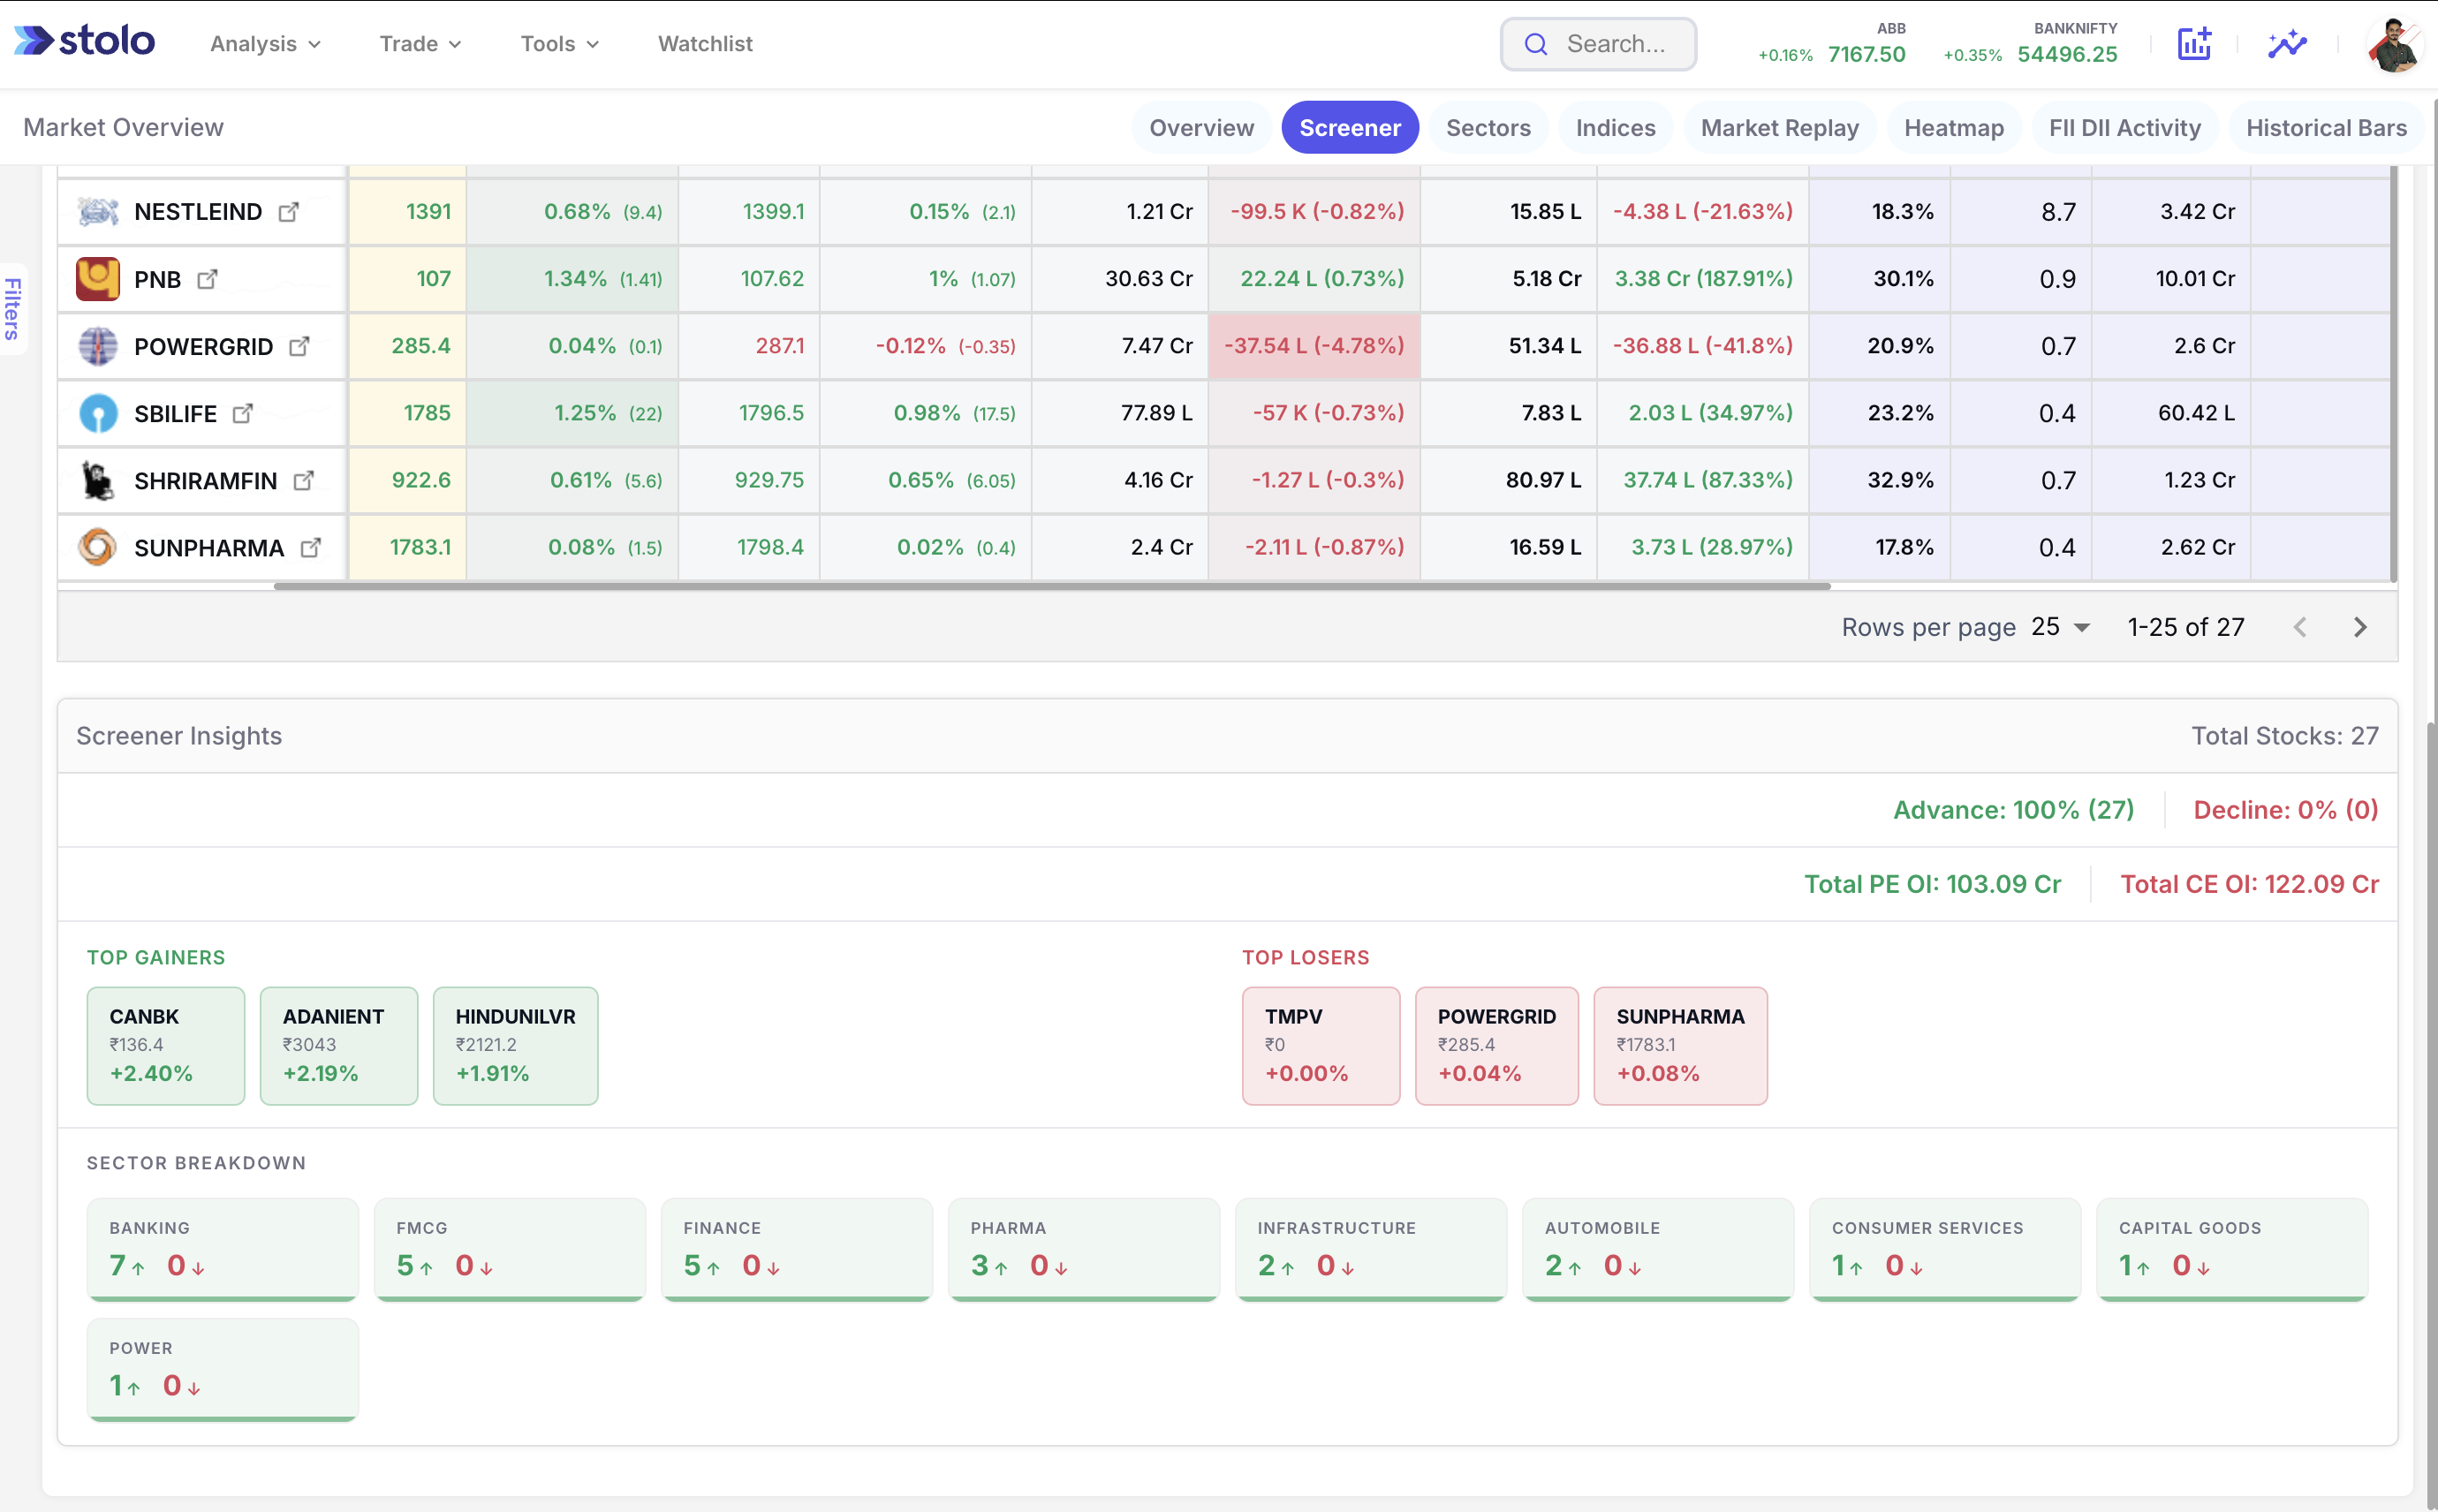
Each stock row shows spot LTP, futures LTP and OI, and the key options metrics (ATM IV, PCR, PE OI) in a single horizontal view with sortable columns.
Below the stock table, a market-breadth summary shows advance/decline ratio, total PE and CE OI, top gainers and losers, and sector breakdown in real time.
Stolo's market screener puts the filter panel, one-click preset signals, a multi-column data view, and a live market-breadth summary in one workspace, so the morning scan doesn't turn into tab-switching.
The left-side filter panel narrows the entire FNO universe by eight independent parameters at once. Pick a sector (Banking, Finance, Auto), an index (Nifty 50, Bank Nifty), a trend by OI action, a gainers/losers classification, and numeric ranges for IV, PCR, futures % change, and OI % change. All of it compounds, so what you get back is a precise list of stocks that clear every condition you set, not just some of them.
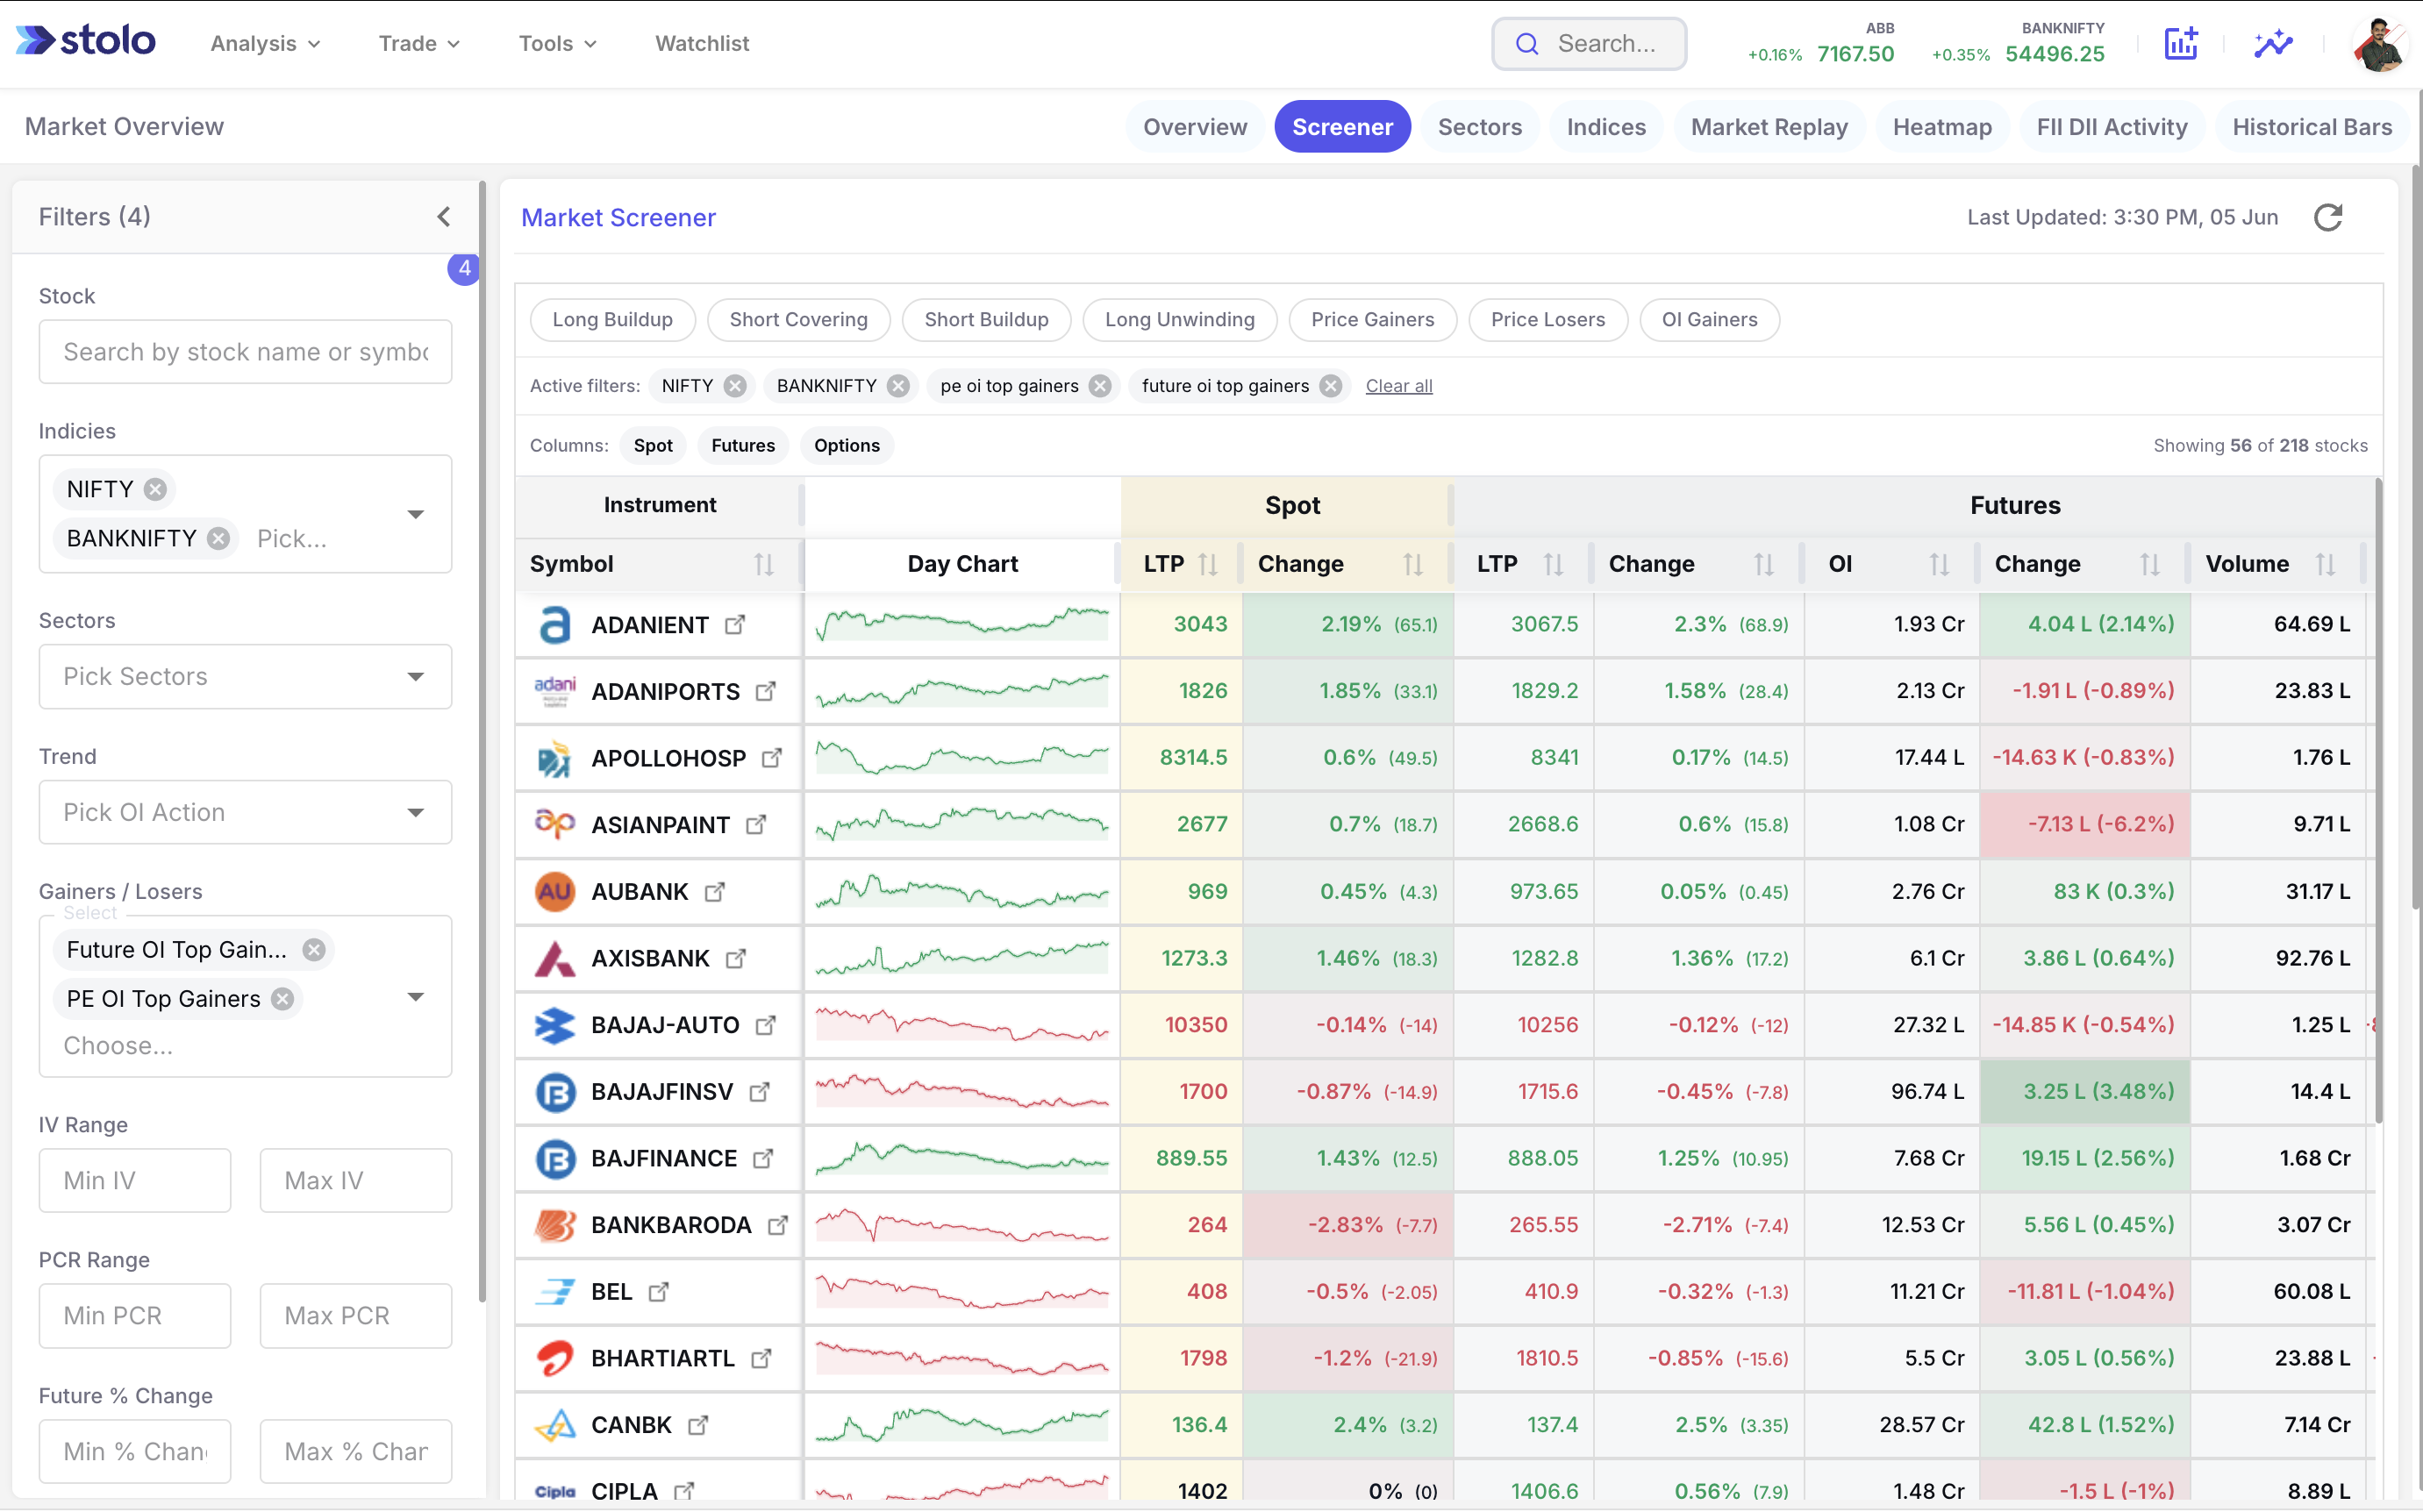
At the top of the screener, seven preset chips isolate specific market activity without touching the sidebar at all. Tap "Long Buildup" and you see every FNO stock with price up and OI rising together, the classic accumulation signal. Tap "Short Covering" to find stocks where the bears are heading for the exit instead. They're built for the first 15 minutes of the session, when speed matters more than precision.
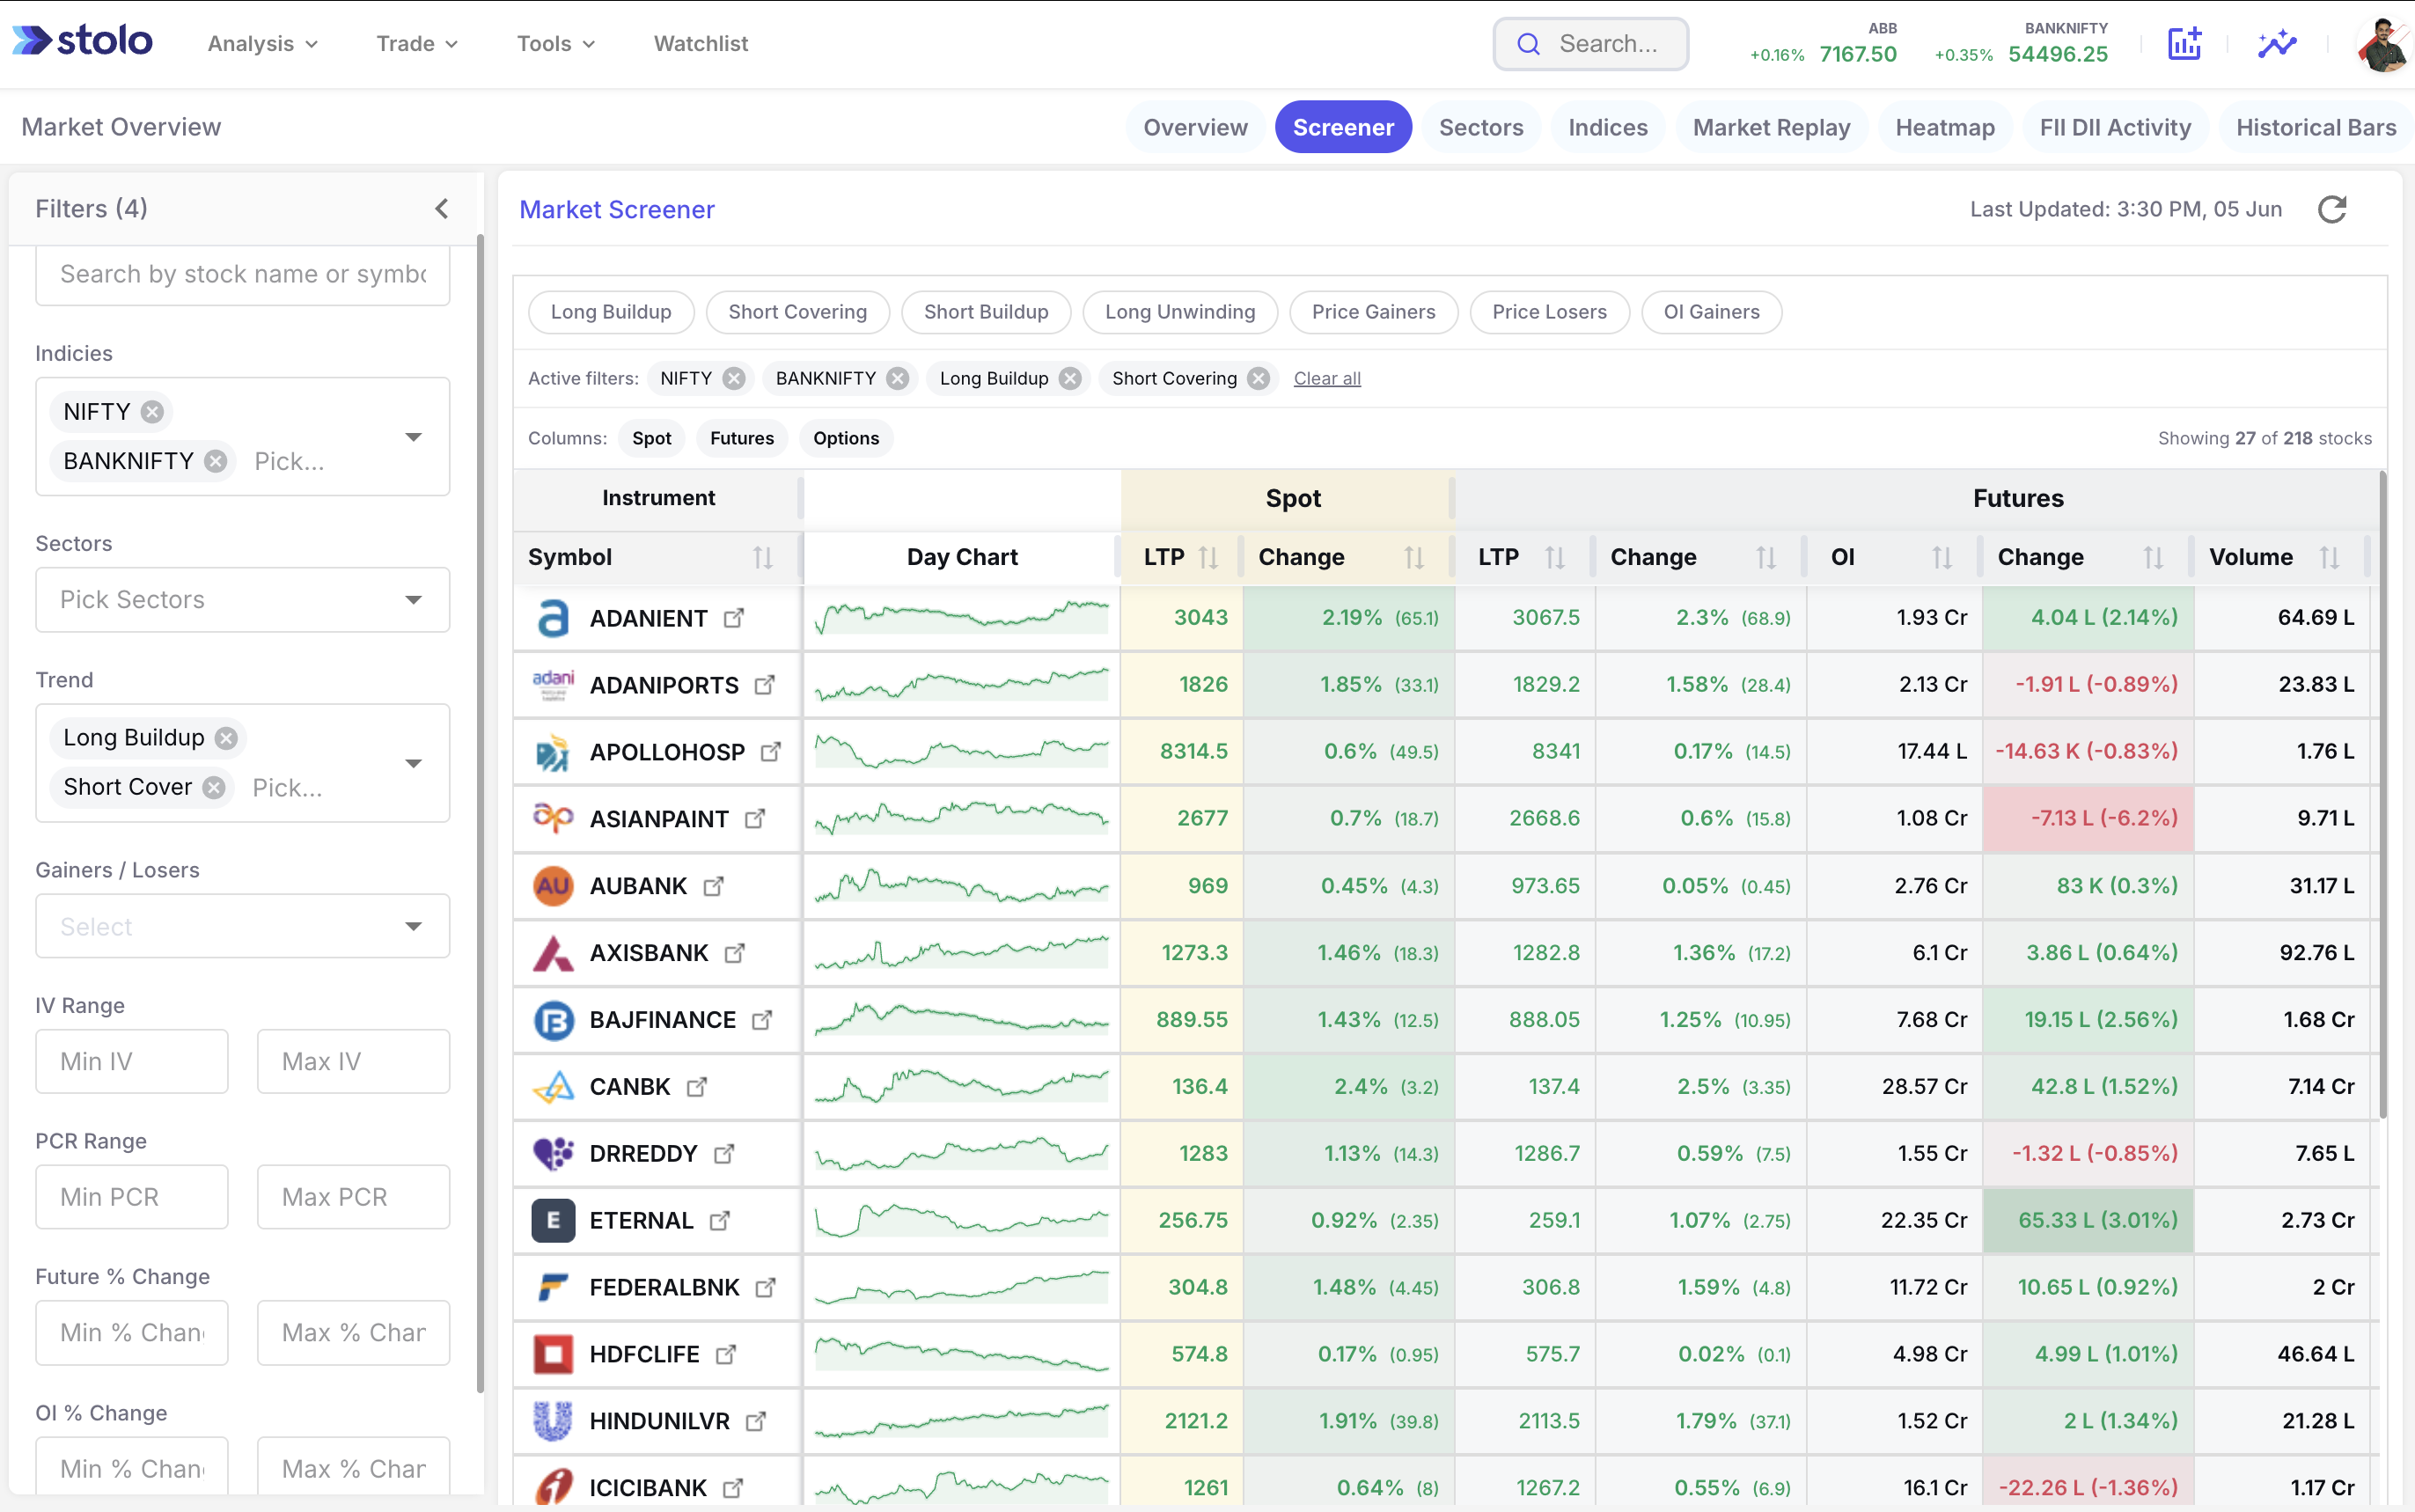
Three column-group toggles (Spot, Futures, Options) keep the table focused on whatever data matters for the trade you're actually planning. Working a futures positional trade? Hide the options columns and let the futures view breathe. Sizing an options position instead? Flip to the Options columns for ATM IV, PCR, PE OI, and PE OI change. Every row also carries an inline day-chart sparkline, so you can read trend direction without leaving the screener at all.
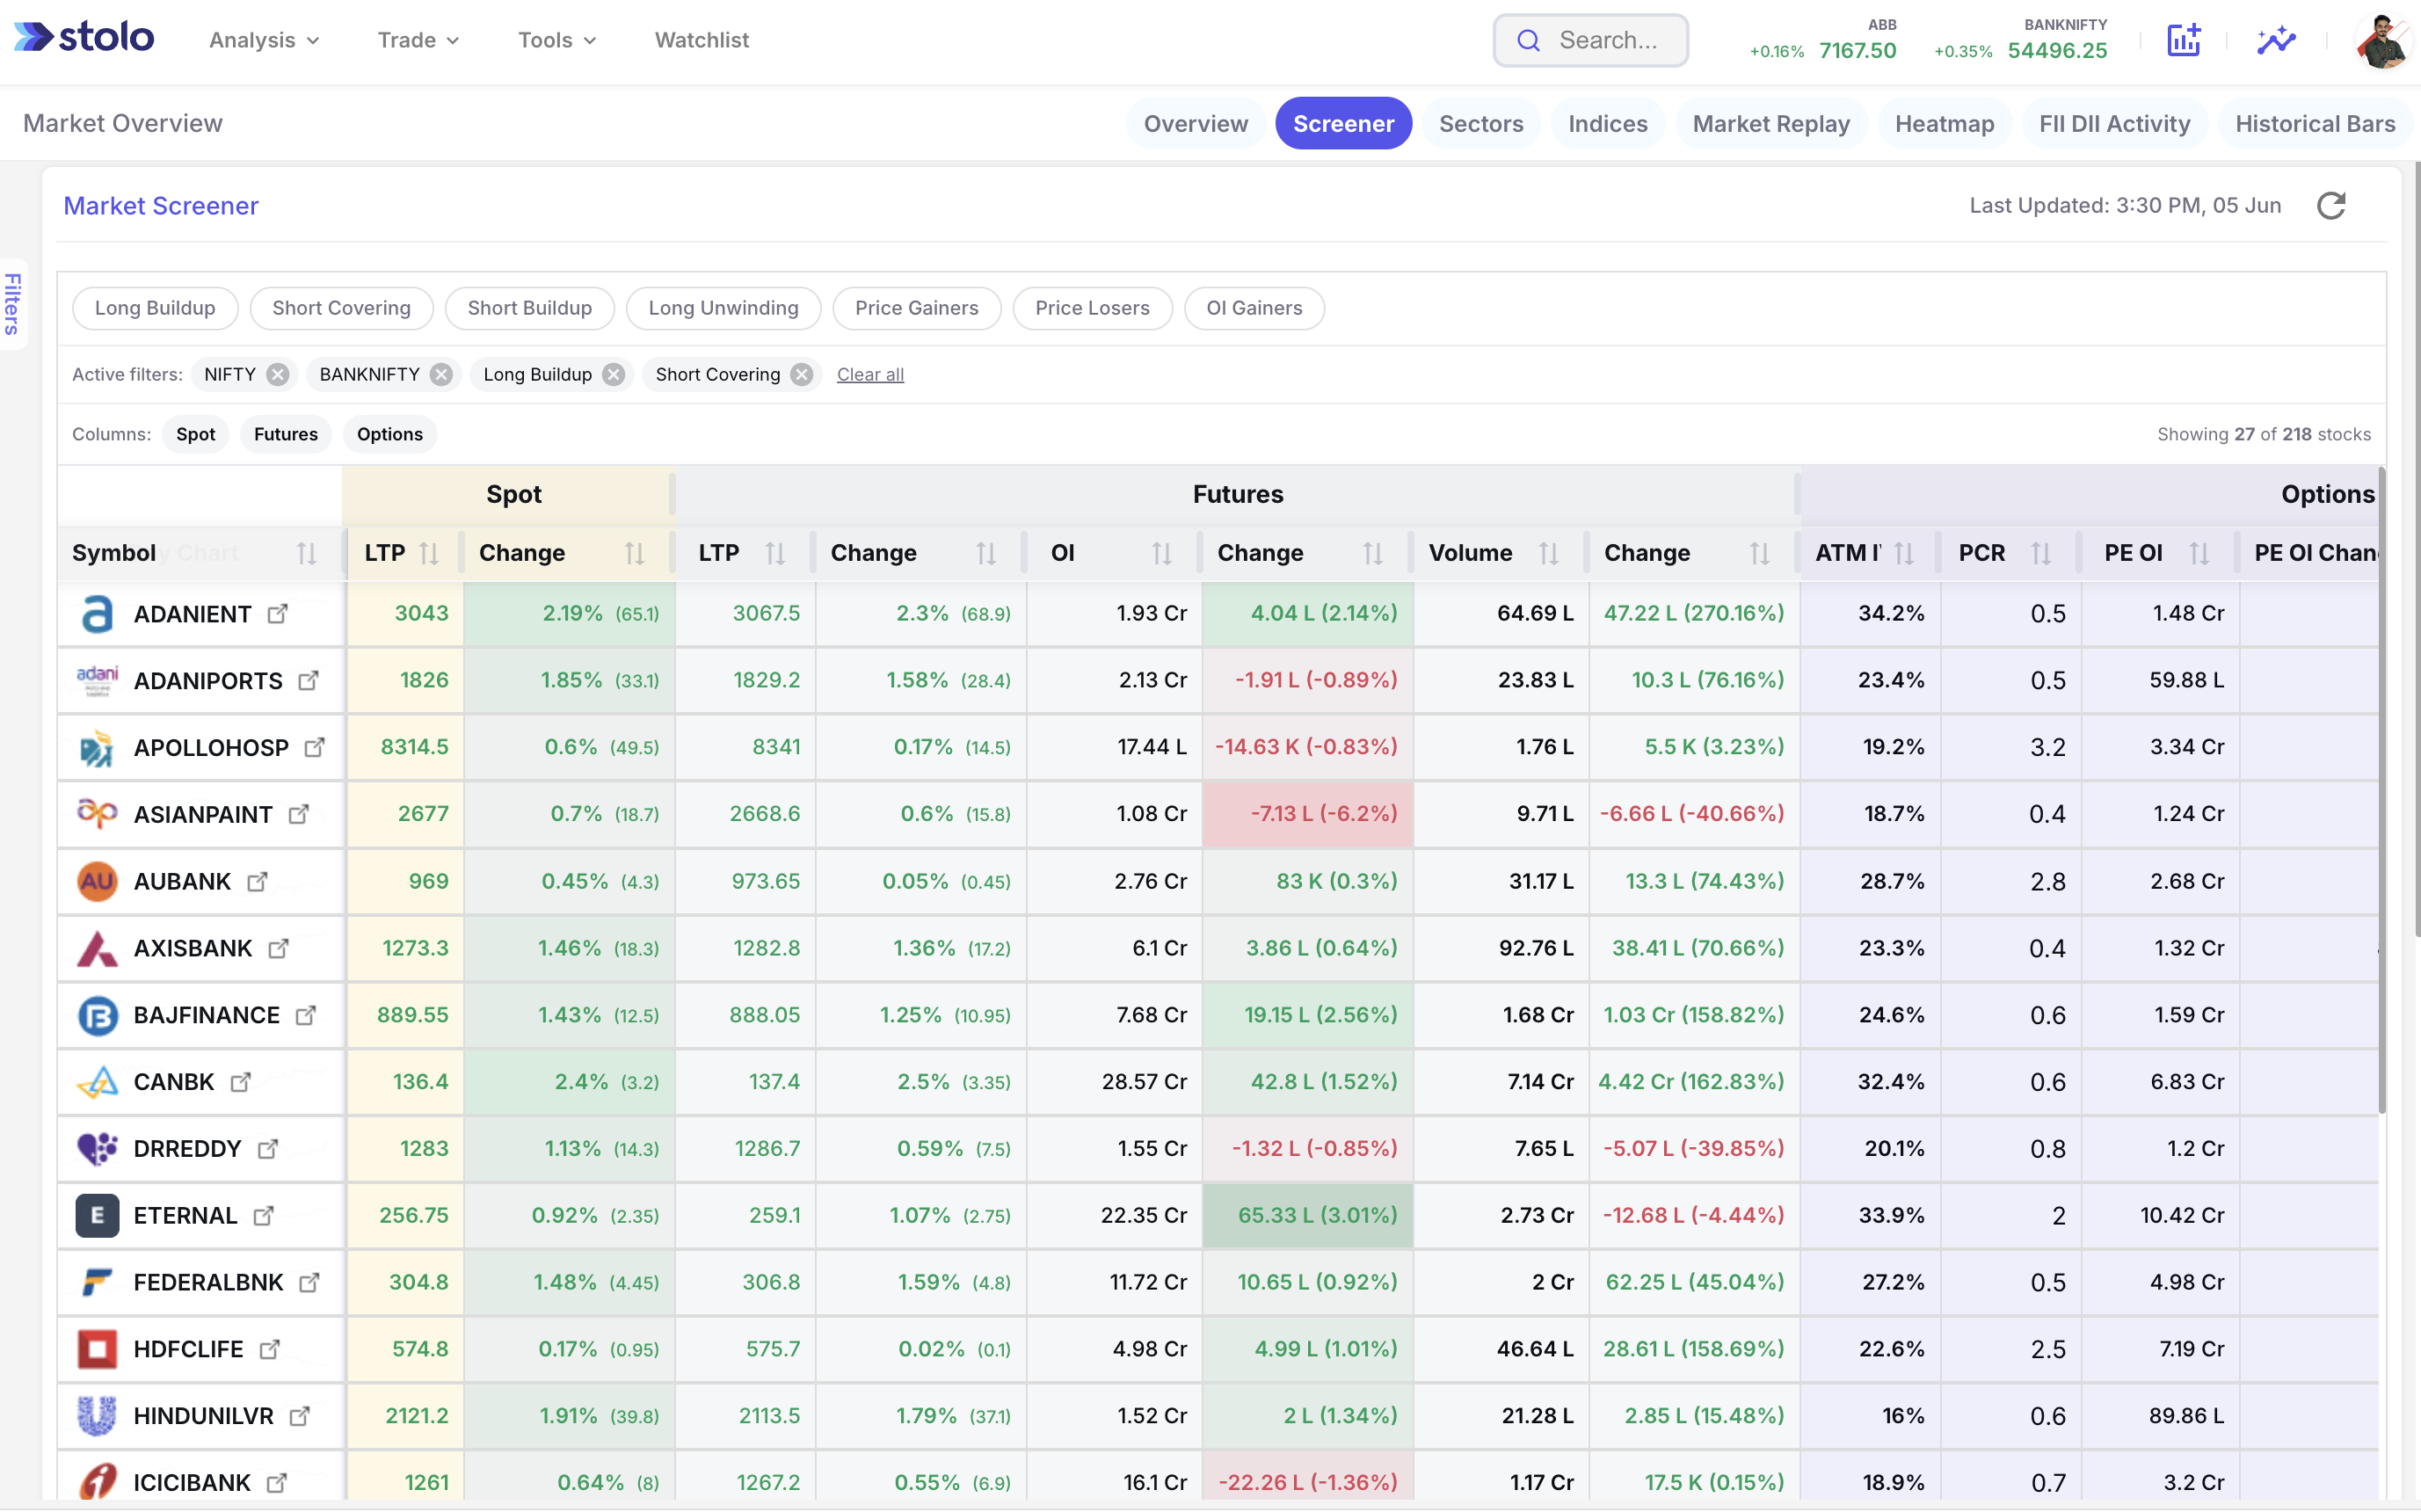
Below the stock table, the Screener Insights panel gives you the macro picture in one glance. You see the total advance-decline count and percentage for the current filtered view, total PE OI and CE OI across all visible stocks, the top gainers and top losers by percentage change, and a full sector breakdown showing how many stocks are advancing or declining per sector. This contextualises individual stock signals within the broader market mood.
Every stock that passes your filter falls into one of four OI-based activity patterns. Understanding which pattern you are looking at is the difference between entering a position with conviction and chasing noise.
Price and OI are climbing together. That combination means buyers are putting on new positions at higher levels rather than just riding an existing one, which is usually the stronger tell. Before acting on it, check that the bid-ask spread is tightening and futures volume is rising alongside it, not lagging behind.
Here price falls while OI rises, which means fresh shorts are being opened at lower prices rather than longs simply exiting. It's usually the bigger participants doing this, not retail, and it reads as a bearish trend confirming itself rather than a one-off dip. This is the setup to look at for put buying or a futures short.
Price is up, OI is down. That's short sellers buying back to close out, not fresh buyers stepping in, so the rally has a shelf life: once the covering is done, there's nothing left to push price up. It's momentum, not a trend change. Jumping into a long here late, without something else confirming it, is how traders get caught on the wrong side of the snap-back.
Both price and OI are dropping, which means existing longs are getting squared off and that's what's pulling price down. It usually shows up near a top or when sentiment is quietly turning, and it doesn't necessarily mean anyone's building fresh shorts, just that the longs have lost their nerve. If you're holding a long here, this is your cue to close it, not a reason to flip short.
A screener is only as good as the routine behind it. Open one without a plan and you'll click through a few presets, get distracted, and end up nowhere in ten minutes. Follow a set sequence instead and you walk away with two or three real setups before 9:30 AM.
Start Scanning NowNavigate to Market Overview and click the "Screener" tab in the top navigation. The screener loads the full FNO universe with default columns showing Spot, Futures, and Options data. All 218 FNO stocks are visible. The last-updated timestamp in the top right tells you exactly when the data was refreshed.
Start with the coarse filters in the left panel. Pick your preferred sector (e.g., Banking) or index (e.g., Bank Nifty) to cut the universe down to a relevant subset, so you're not distracted by signals in sectors you're not trading that day. Then set an IV Range if your options strategy has a volatility preference.
Click one of the seven quick filter chips. Long Buildup is usually the best starting point on a trending day. The screener immediately narrows to stocks matching that pattern, and if the list is still too long, layer in a PCR range or OI % Change filter from the sidebar until you're down to five candidates or fewer.
Toggle the Spot / Futures / Options column groups to show only the data relevant to your setup. If you are looking at an options trade, enable the Options columns for ATM IV and PCR. If you are scalping futures, switch to Futures columns and sort by OI Change descending to surface the highest-activity contracts at the top.
Scroll below the table to the Screener Insights section and check the advance-decline ratio. If 70%+ of FNO stocks are declining, a bullish setup in one stock is carrying more risk than it looks like. The sector breakdown tells you whether your shortlisted sector is broadly participating or an isolated outlier, and the Top Gainers/Losers list is worth a glance just so you don't chase something already extended.
Click out from the screener into the OI Analysis or Option Chain for your shortlisted stock to verify the signal holds at the strike level. A Long Buildup in the screener confirmed by rising call OI at the nearest strike is a much higher-probability setup than a screener signal alone. Only then define your entry, stop-loss, and target before placing the trade.
These three tools are often confused with each other. Each answers a different question at a different level of zoom.
Scans all 200+ FNO stocks simultaneously and ranks them by your chosen criteria. Answers the question: which stocks should I be looking at right now?
Focuses specifically on open interest changes across stocks or strikes. Useful for isolating OI buildup patterns, but lacks the Spot and Options column context of a full market screener.
Gives a deep, strike-by-strike breakdown for a single stock or index. Essential for sizing a trade once you have found the stock using a screener, but cannot scan multiple stocks at once.
In practice, most traders move between all three in the same order: the Market Screener to find the stock, OI Analysis to confirm the signal is real, then the Option Chain to actually size and place the trade.
Try the Full WorkflowMost traders use a broker's built-in watchlist or a generic stock screener and wonder why they keep missing setups. Here is how Stolo's market screener compares.
| Feature | Stolo | Broker Platforms | Generic Stock Screeners |
|---|---|---|---|
| Full FNO universe scan (200+ stocks) | Watchlist only | Partial | |
| OI-based quick filter presets (Long Buildup, Short Covering, etc.) | |||
| IV Range filter | |||
| PCR Range filter | |||
| Spot + Futures + Options in one row | Spot only | ||
| Show / hide column groups | Partial | ||
| Inline day chart sparkline per stock | Limited | ||
| Screener Insights (breadth, sector breakdown, top movers) | |||
| Sector and Index filter | Index only | ||
| OI % Change and Future % Change numeric filters |
Questions?
What traders actually ask about scanning the FNO market, OI-based filters, and finding setups on NSE before the questions in your own head come up.
Trader Voices
Every trade is a small bet on a dream, backed by risk and a decision you have to own. Stolo is built for traders who bring purpose and discipline to that decision, not just numbers.

My first impression of your site, "K.I.S.S."..... Simple yet effective...uncluttered and has all the ingredients a trader actually needs not the nonsensical ones... great job
These are unedited testimonials from traders in our Telegram community. Photos shown are AI-generated and used for representation only.

You have something unique in your platform that has changed my trading. I have used Quantsapp earlier didn't find it useful. I have tried opstra, sensibull etc.
These are unedited testimonials from traders in our Telegram community. Photos shown are AI-generated and used for representation only.

Dear Sir, I am really impressed with the user interface and multiple other facilities for option traders.
These are unedited testimonials from traders in our Telegram community. Photos shown are AI-generated and used for representation only.
Got a question or a feature you wish existed? Drop it in our Telegram community, the Stolo team is right there reading every message.