Trader Voices
Why Smart Traders Choose Stolo?
Every trade is a small bet on a dream, backed by risk and a decision you have to own. Stolo is built for traders who bring purpose and discipline to that decision, not just numbers.
Live TradingView Charts for Options Trading Analysis - Stolo uses charts by TradingView, which is a global trading platform that provides an exceptional charting experience by which Stolo users can conveniently track the prices of different instruments of indices, stock options, futures, & more.
No credit card required · Trial Plan available · Setup in 3 minutes

Most F&O traders run TradingView in one tab and their options data in another, and they pay for that split attention every session.
Every time you switch from TradingView to your OI tool and back, you lose context. By the time you return to the chart, the setup has changed. Scalpers cannot afford that lag, since milliseconds matter when price is at a key level.
Most charting tools do not save your full indicator and drawing setup persistently. You spend 20 minutes each morning rebuilding the same chart you had yesterday instead of doing analysis before the 9:15 open.
A breakout on the chart means nothing if you do not know whether open interest is building or unwinding at that level. Standalone charting tools show price, not the market structure that gives price its meaning.
TradingView charts go beyond a visual layer here, functioning as a professional analysis engine embedded inside your F&O workflow.
TradingView is the charting engine used by millions of professional and retail traders worldwide. Stolo integrates its full charting library (indicators, drawing tools, timeframes, saved layouts) directly inside your F&O analysis dashboard. You get the same chart quality that powers institutional desks, without leaving the platform or maintaining a separate subscription. This is what integrated F&O analysis looks like in practice.
Stolo lets you open multiple TradingView charts at the same time within a single view. Compare Nifty and BankNifty side by side, or monitor an index alongside a constituent F&O stock, all without switching tabs or losing context. Multi-chart view is how professional traders build situational awareness before and during live sessions, and it is available inside Stolo's scalping terminal as well as the standard analysis view.
Chart replay lets you replay historical price action bar by bar on TradingView charts. Use it to back-test how your indicator setup would have responded to past Nifty expiry sessions, study how specific breakouts formed, or practise identifying setups without putting capital at risk. Chart replay is available directly on Stolo and is particularly useful for scalpers refining their entry criteria on 1-min and 5-min timeframes.
Integrated charting means TradingView charts and Stolo's OI data, PCR, FII/DII flow, and option chain all live in the same interface. When price tests a key level on the chart and OI is simultaneously building at that strike, you see both signals together. Price action plus market positioning, seen at once, is what separates informed entries from reactive guesses in F&O trading.
Every charting capability you need for NSE F&O analysis and scalping, in one place.

Switch between candlestick, Heikin Ashi, Renko, and more. Adjust colours, grid, and layout to match your personal analysis style.

Switch between 1-min, 5-min, 15-min, hourly, and daily charts instantly. Confirm F&O entries across timeframes before execution, essential for scalpers and positional traders alike.

Draw trend lines, Fibonacci retracements, channels, and support/resistance levels. All drawings save automatically with your layout, ready for tomorrow's session.

RSI, MACD, Bollinger Bands, Supertrend, EMA, SMA, Stochastic, ATR, VWAP, all applied directly to Nifty, BankNifty, or any F&O stock. Combine them and save the stack.

Live price data for Nifty, BankNifty, FinNifty, and all 191 NSE F&O stocks, the same feed that powers institutional analysis desks, with no approximation or scraping.

Open multiple TradingView charts at once inside Stolo. Compare Nifty and BankNifty side by side without switching tabs, with full multi-chart view for scalpers and analysts.

Save named setups: indicator combinations, timeframes, drawing sets. Switch between your Nifty scalping view and BankNifty positional layout in seconds from the same screen.

Capture your chart with indicators and drawings intact. Share setups with your trading community or attach them directly to your Stolo Trading Journal entry.
Replay historical price action bar by bar on any instrument. Back-test your setups on past Nifty and BankNifty sessions to refine your edge before committing capital.
From opening the platform to acting on a live setup, here is a structured workflow for getting the most from integrated charting alongside your F&O data.
Start Your TrialLog in to Stolo and navigate to the Charts section from the main dashboard. TradingView loads directly, no external login, no separate subscription needed. Your last saved layout opens automatically so you resume exactly where you left off.
Choose Nifty, BankNifty, FinNifty, or any of the 191 NSE F&O stocks from the instrument selector. Set your primary timeframe: most scalpers start on 5-min; positional traders on hourly or daily. The real-time data loads immediately.
Add your indicator stack (RSI, Supertrend, EMA, VWAP) from the built-in library. Draw support and resistance levels, Fibonacci retracements, and trend lines needed for the session. Save the layout so tomorrow's setup is ready in one click.
Use Stolo's multi-chart view to open a second TradingView chart alongside the first. Watching BankNifty while trading Nifty options helps you spot divergence before it shows on the primary chart, which is a key edge for scalpers managing intraday risk.
When your chart shows price approaching a key level, check Stolo's OI Analysis panel without leaving the screen. A price breakout confirmed by rising OI at that strike is a significantly higher-confidence signal than price action alone, and that is the core advantage of integrated charting.
TradingView charts give you everything professional traders use globally: RSI, MACD, Bollinger Bands, Supertrend, moving averages, Fibonacci retracements, and trend lines, all applied directly to NSE F&O instruments in real time.
When you combine TradingView charts with Stolo's OI Analysis and PCR data in the same platform, you get the full picture: price action confirmed by market positioning. That combination is what separates disciplined F&O analysis from guesswork.
Try It Now

TradingView charts on Stolo remove the need to run separate charting tools alongside your analysis platform. Monitor Nifty, BankNifty, and F&O stocks on the same screen as your OI data, switch timeframes in one click, and apply saved layouts instantly.
With multi-chart view, you watch two instruments simultaneously, catching BankNifty breakdowns before they ripple into Nifty, for example, without additional subscriptions or any platform switching during live sessions.
Open Your AccountTradingView charts on Stolo work seamlessly across devices. Your saved layouts, indicators, and drawings sync across desktop and mobile, so the chart setup you built before market open is ready the moment you open Stolo on your phone during market hours.
Do your pre-market analysis on desktop in the morning, then check a position from your phone at lunch. Stolo's TradingView integration keeps you connected to the chart with no compromise on functionality, including multi-chart view and chart replay.
Start Your Trial
Most traders use TradingView separately from their F&O tools. Here is what changes when charting is integrated alongside live OI and options data.
| Feature | Stolo | TradingView.com | Zerodha Kite | Generic Broker Charts |
|---|---|---|---|---|
| TradingView charting engine | ||||
| Multiple charts simultaneously | ||||
| Chart replay | ||||
| Live OI & PCR data alongside charts | ||||
| NSE-authorised real-time data | ||||
| 191 NSE F&O stocks supported | ||||
| Saved chart layouts | ||||
| Integrated option chain | ||||
| Used inside scalping terminal |
Having TradingView is one thing. What it can do once it shares a screen with your live options data is the real reason traders stay.

TradingView is used by millions of traders worldwide. If you have ever used TradingView.com, you already know how to use the charts on Stolo: same interface, same keyboard shortcuts, same familiar layout. Zero relearning required.

From indicator combinations to chart colours and layout configurations, TradingView charts on Stolo adapt to your workflow. Save multiple layouts for different strategies and instruments, including separate setups for scalping and positional trading.

Unlike standalone TradingView, Stolo pairs price charts with live OI Analysis, PCR, and FII/DII data, so you see price action and market positioning together. This combination is how institutional analysts trade, now available to every retail F&O trader.
Questions?
Direct answers to the most-searched questions about TradingView charts, multiple charts view, chart replay, and F&O analysis on Stolo
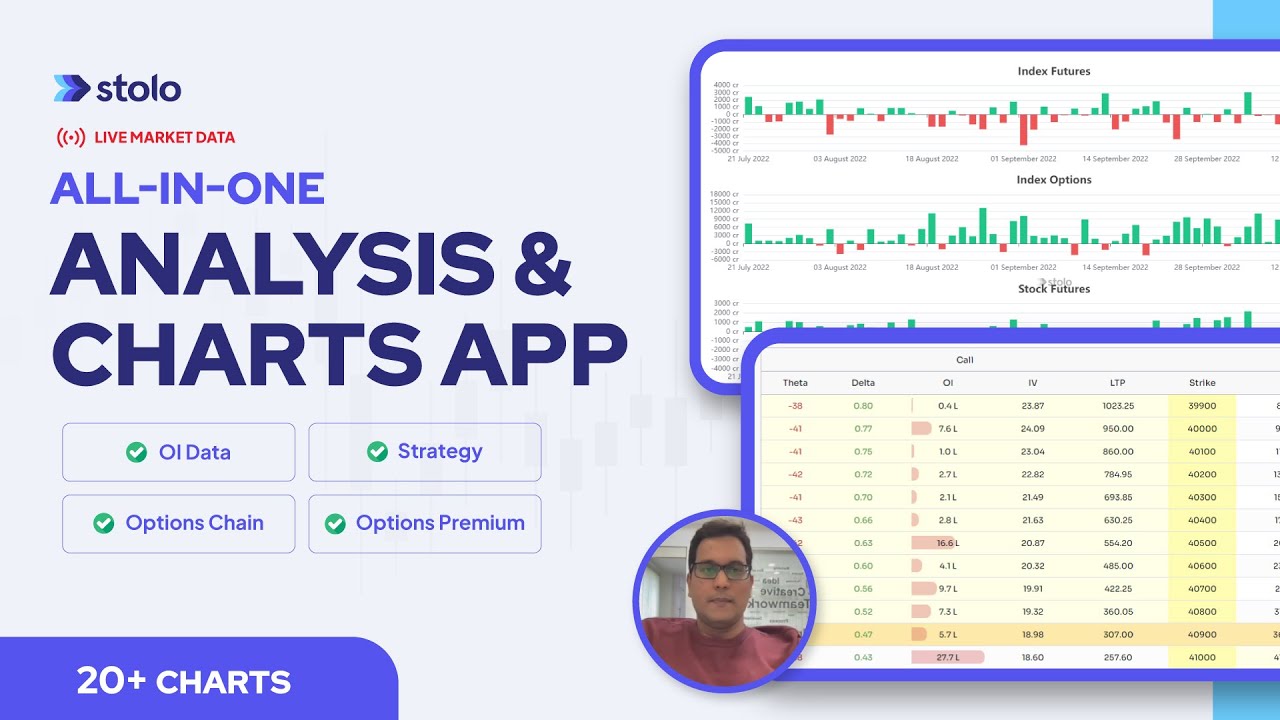
Stolo integrates TradingView's world-class charting library directly into your F&O analysis workflow. Track Nifty, BankNifty, FinNifty, and all 191 NSE F&O stocks with 20+ indicators, multi-timeframe views, multiple charts simultaneously, chart replay, and saved layouts, alongside live OI and PCR data, all in one platform.
Trader Voices
Every trade is a small bet on a dream, backed by risk and a decision you have to own. Stolo is built for traders who bring purpose and discipline to that decision, not just numbers.

My first impression of your site, "K.I.S.S."..... Simple yet effective...uncluttered and has all the ingredients a trader actually needs not the nonsensical ones... great job
These are unedited testimonials from traders in our Telegram community. Photos shown are AI-generated and used for representation only.

You have something unique in your platform that has changed my trading. I have used Quantsapp earlier didn't find it useful. I have tried opstra, sensibull etc.
These are unedited testimonials from traders in our Telegram community. Photos shown are AI-generated and used for representation only.

Dear Sir, I am really impressed with the user interface and multiple other facilities for option traders.
These are unedited testimonials from traders in our Telegram community. Photos shown are AI-generated and used for representation only.
Got a question or a feature you wish existed? Drop it in our Telegram community, the Stolo team is right there reading every message.