_Analysis.webp)


Trader Voices
Why Smart Traders Choose Stolo?
Every trade is a small bet on a dream, backed by risk and a decision you have to own. Stolo is built for traders who bring purpose and discipline to that decision, not just numbers.
Ultimate Tool for F&O Analysis & Charts - Tool with accurate OI data and 20+ charts for Option Chain, Open Interest (OI) Analysis, FII / DII data, Sectoral Indices & more to analyse live options market across Nifty, BankNifty & all F&O.
No credit card required · Trial Plan available · Setup in 3 minutes
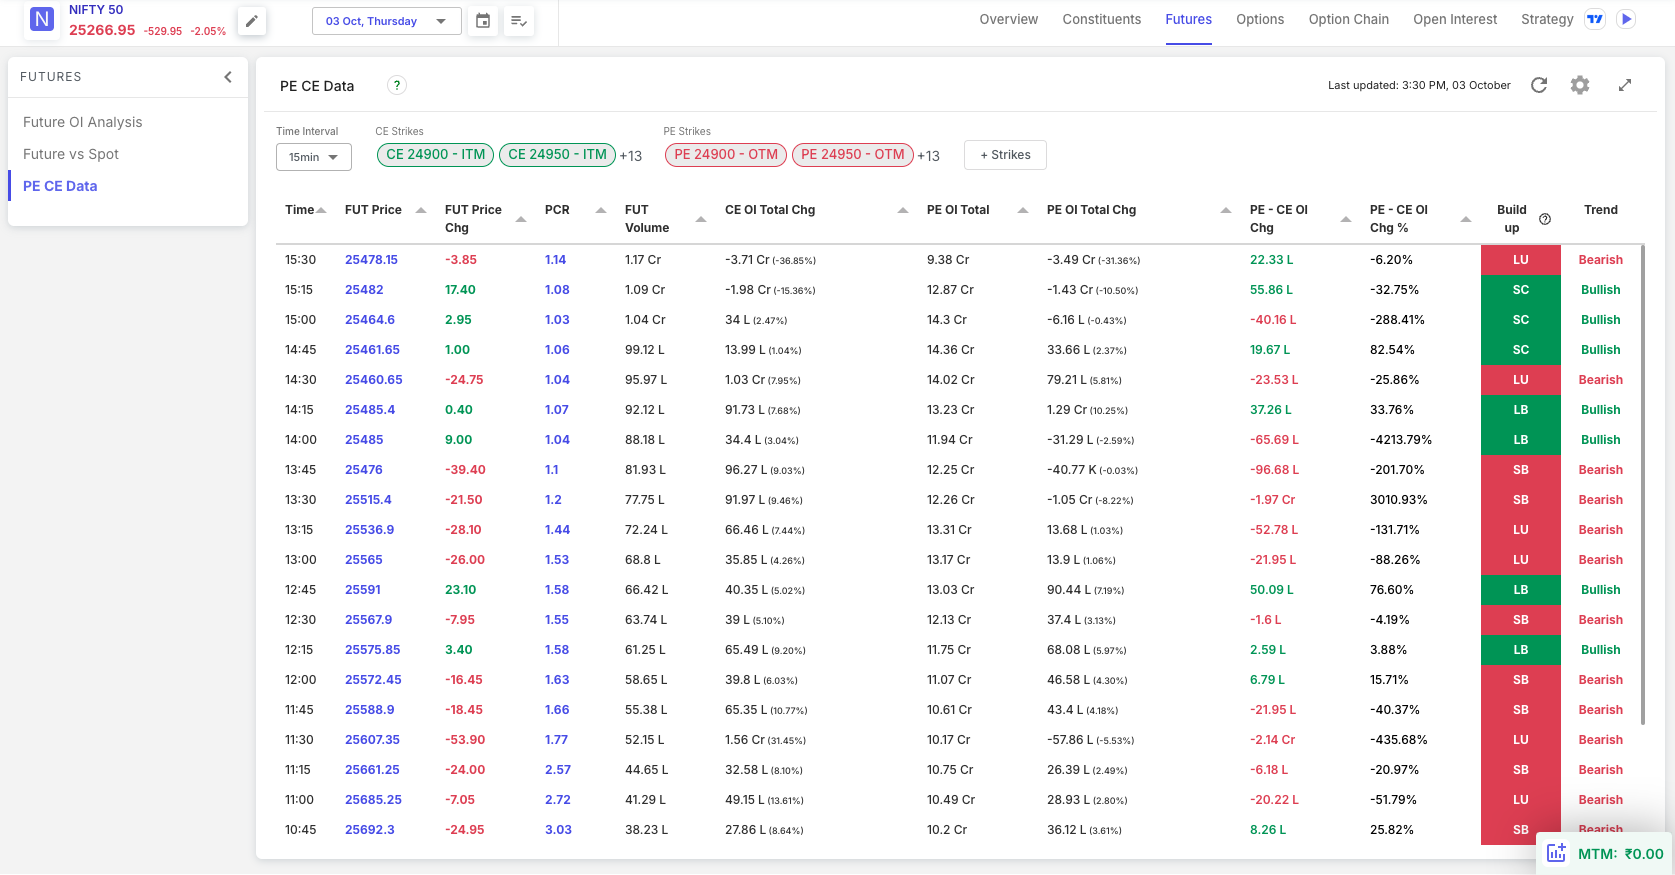
OI, FII/DII, PCR, option chain, technical charts, all living on different platforms. By the time you've pieced together a market view, the setup has already moved.
OI on one tab, FII data on another, PCR on a third, price charts in a separate window entirely. Context gets lost every time you switch, and the market doesn't wait around while you reassemble your view from five different places.
A PCR reading means nothing without OI context. An OI spike means nothing without price direction attached. Disconnected data forces you into manual interpretation, and manual interpretation under time pressure is exactly where retail traders make their worst calls.
Most free platforms show NSE data delayed by 15 minutes. In F&O trading, that's often the gap between entering a breakout and buying the top of a move that's already reversed. Real market analysis needs real-time data, which means an NSE-authorised feed rather than a delayed snapshot.
Nifty, BankNifty, FinNifty, and 191 F&O stocks: tracking direction across all of them without one unified platform means fragmented analysis and signals you'll miss. A single view pulling all this together isn't a nice-to-have for serious F&O traders. It's the baseline.
Knowing what each data type actually shows, and how they fit together, is the foundation of informed F&O trading.
Analysis charts take raw market data (OI, price, volume, PCR, institutional flows) and turn it into something you can actually read. For F&O traders, that structure is what lets you form a view on direction before committing capital. Stolo covers 20+ chart types in one platform, all updated in real time from NSE.
Open Interest tracks committed money, not just transacted money. A rising OI chart shows you which direction institutions are building positions in, often before price gets around to confirming it. Between the option chain, strikewise OI, multi-strike OI, and OI charts, Stolo gives you a real-time read on where the large money actually sits across every F&O instrument.
Foreign and Domestic Institutional Investors move markets. When FIIs aggressively build or exit index future positions, Nifty and BankNifty follow. Stolo's FII/DII tracker gives you this data in real time during market hours, letting you align your options strategy with institutional flows rather than trade blindly against them.
No single chart gives you the full picture. The option chain shows where money is positioned, the PCR chart shows sentiment, TradingView gives price context, FII/DII gives institutional direction. Professional F&O traders build their market view by pulling all four together, in one place, without hopping between tabs to do it.
Market data, OI analysis, technical charts, and institutional flows: everything an F&O trader actually needs, in one place.

NSE-authorised, real-time options market data with zero lag, across 20+ technical analysis charts. Minute-by-minute OI, volume, and price updates on Nifty, BankNifty, FinNifty, and every F&O stock, so your decisions are based on what the market is doing right now, not ten minutes ago.

Read market direction through in-depth OI analysis: Option Chain, Call/Put OI, Multi-Strike OI, OI Chart, and Stolo's own Options Snapshot. All of it available across Nifty, BankNifty, FinNifty, and the full list of 191 NSE F&O stocks, sourced live straight from the exchange.

Professional-grade technical analysis charts in an interface that doesn't need a manual. Read market movement, spot trends, and time your F&O trades across Nifty, BankNifty, FinNifty, and the top F&O stocks, on TradingView-powered charts built right into the platform.

NSE-authorised charting and analysis data for F&O traders. From PCR charts to FII/DII flows, every data point you need to trade with confidence lives in one place, updated continuously through market hours, with nothing approximated or scraped from a third party.
From option chain to FII/DII flows, every market analysis tool an F&O trader needs, updated in real time across Nifty, BankNifty, FinNifty, and all 191 F&O stocks.

Compare OI across multiple strikes side by side. Spot max pain, key concentration zones, and where the market is likely to anchor near expiry.
Explore Multi-Strike OI
See open interest distributed across every active strike. Identify true support and resistance zones backed by actual option writing data.
Explore Strikewise OIA structured daily process, from session prep to trade selection, using nothing but Stolo's own charts and data. No switching platforms mid-flow.
Start AnalysingBefore you look at anything else, check Stolo's FII/DII tracker. Net buying by FIIs in index futures usually means the broader market has institutional tailwind for the session; heavy selling shifts the bias the other way. This is worth doing first because it colours how you read every chart that follows, not just one of them.
Open the option chain for Nifty or BankNifty and find the strikes with the heaviest call writing and put writing. Those strikes mark out the session's likely range: heavy call OI is resistance, heavy put OI is support. These levels tend to hold up better than pure price-pattern levels, simply because they're backed by actual committed capital rather than a chart pattern from last week.
Pull up the PCR chart and see where the ratio sits against its recent range. Above 1.2 usually means more put writing, which points to a bullish tilt among option writers expecting the market to hold or rise; a low reading suggests the opposite view from the same crowd. This is what tells you whether to lean into directional trades or expect a range-bound day.
With an OI-backed level and a sentiment read from PCR in hand, switch to the TradingView chart for the instrument. Watch for price approaching that OI-identified level, then use a technical trigger, a candlestick pattern, a moving average cross, a volume spike, whatever fits, to time the actual entry. OI gives you the zone; the chart gives you the moment.
Once you're in the trade, keep Stolo's live market data views open: sector movements, top gainers/losers, OI changes, whatever tells you the market is still moving the way you expected. Falling OI on your instrument while you're holding a position is an early sign that participants are heading out. Check it against Stolo's OI analysis tools so you're ahead of a reversal instead of reacting to it after price has already moved.
How Stolo's analysis charts and data for market insights compare to the platforms most Indian F&O traders use today.
| Capability | Stolo | NSE Website | TradingView | Generic Brokers |
|---|---|---|---|---|
| Real-time NSE data (zero delay) | ||||
| OI analysis (option chain, multi-strike, strikewise) | ||||
| FII / DII data (intraday + daily) | ||||
| PCR chart plotted over time | ||||
| TradingView technical charts integrated | ||||
| 20+ analysis chart types in one platform | ||||
| 191 F&O stocks + indices coverage | ||||
| Mobile app with full analysis access |
Four data dimensions that, together, give you a market view no single chart type can provide on its own.
OI tells you how many contracts are outstanding at each strike, and how that number is moving. Watch it build at a specific strike and you've found a support or resistance zone with actual traders behind it, not just a line someone drew on a chart. Across option chain, multi-strike OI, strikewise OI, and OI charts, Stolo shows you where that institutional money actually sits, live, on Nifty, BankNifty, FinNifty, and all 191 F&O stocks.
Foreign and Domestic Institutional Investors move this market more than any retail crowd does, and heavy FII buying or selling in index futures usually drags Nifty and BankNifty along with it. Stolo's FII/DII tracker gives you daily derivatives and capital market data, live during market hours rather than as a next-day summary, so you can position with that flow instead of fighting it.
The Put-Call Ratio is one of the steadier sentiment indicators in options trading. Skewed high, it points to more put writing and a bullish tilt; skewed low, the opposite. Stolo's live PCR charts track this alongside price and OI, and pairing it with Stolo's own Options Snapshot tool catches large OI shifts before they move the market, usually before most retail traders have even noticed.
No trade happens in isolation, even though it's tempting to analyse it that way. Stolo's sectoral indices view shows which sectors are leading or lagging, giving you macro context before you place an options trade. Add in the top gainers/losers and market movers views and you get a full-market read, so you're not making a call on one instrument's chart while missing a sector-wide move happening around it. Come discuss market reads with other F&O traders on the Stolo Telegram community.
Learn how to use OI analysis, option chains, FII/DII data, and more to trade F&O with greater clarity and confidence.
Questions?
What traders actually want to know about F&O analysis charts, OI tools, and market data on Stolo
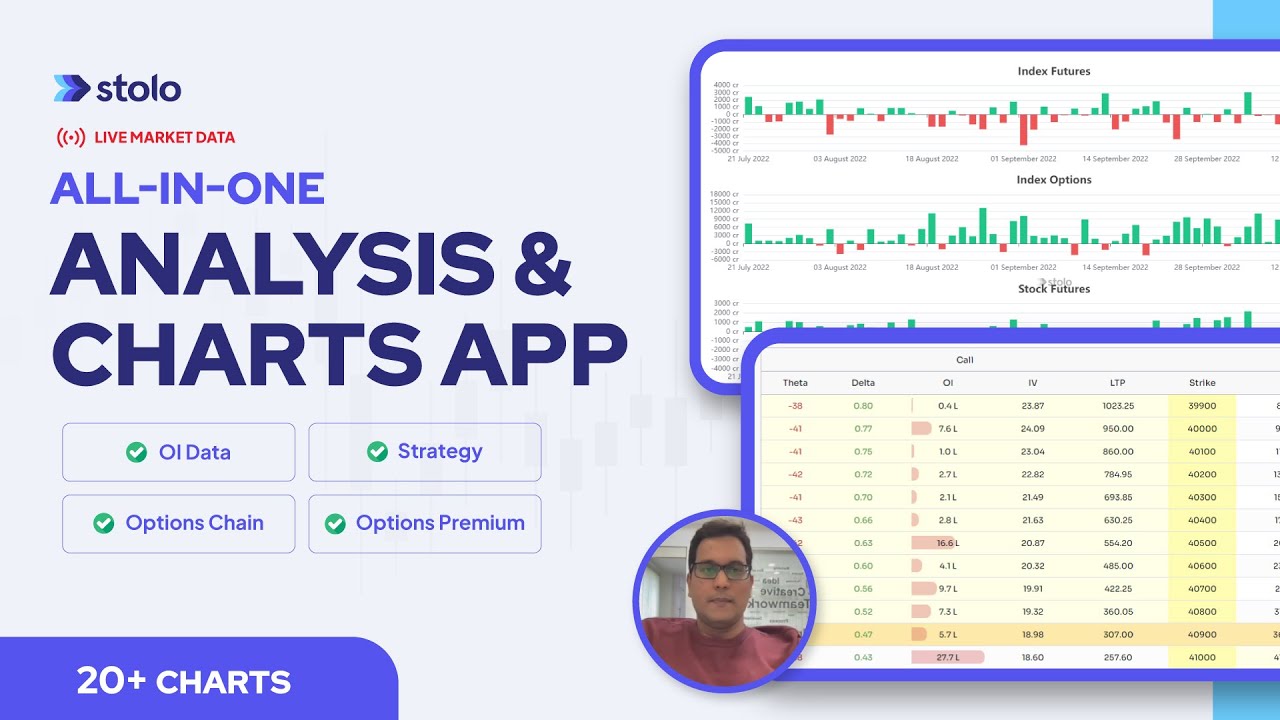
Stolo's analysis charts and data for market insights bring together OI analysis, FII/DII data, PCR charts, option chain, multi-strike OI, strikewise OI, and TradingView charts, all in one platform with NSE-authorised real-time data across Nifty, BankNifty, FinNifty, and all 191 NSE F&O stocks.
Trader Voices
Every trade is a small bet on a dream, backed by risk and a decision you have to own. Stolo is built for traders who bring purpose and discipline to that decision, not just numbers.

My first impression of your site, "K.I.S.S."..... Simple yet effective...uncluttered and has all the ingredients a trader actually needs not the nonsensical ones... great job
These are unedited testimonials from traders in our Telegram community. Photos shown are AI-generated and used for representation only.

You have something unique in your platform that has changed my trading. I have used Quantsapp earlier didn't find it useful. I have tried opstra, sensibull etc.
These are unedited testimonials from traders in our Telegram community. Photos shown are AI-generated and used for representation only.

Dear Sir, I am really impressed with the user interface and multiple other facilities for option traders.
These are unedited testimonials from traders in our Telegram community. Photos shown are AI-generated and used for representation only.
Got a question or a feature you wish existed? Drop it in our Telegram community, the Stolo team is right there reading every message.