Trader Voices
Why Smart Traders Choose Stolo?
Every trade is a small bet on a dream, backed by risk and a decision you have to own. Stolo is built for traders who bring purpose and discipline to that decision, not just numbers.
Scan every NSE F&O stock for opening range breakouts as they happen. Set your opening range to 5, 15, 30 or 60 minutes, filter for a real volume surge, exclude gap-and-go opens, then replay any past session with a simulated P&L to test the rule set before you trade it.
Paid trial from ₹199 · Full Pro access · Setup in 3 minutes
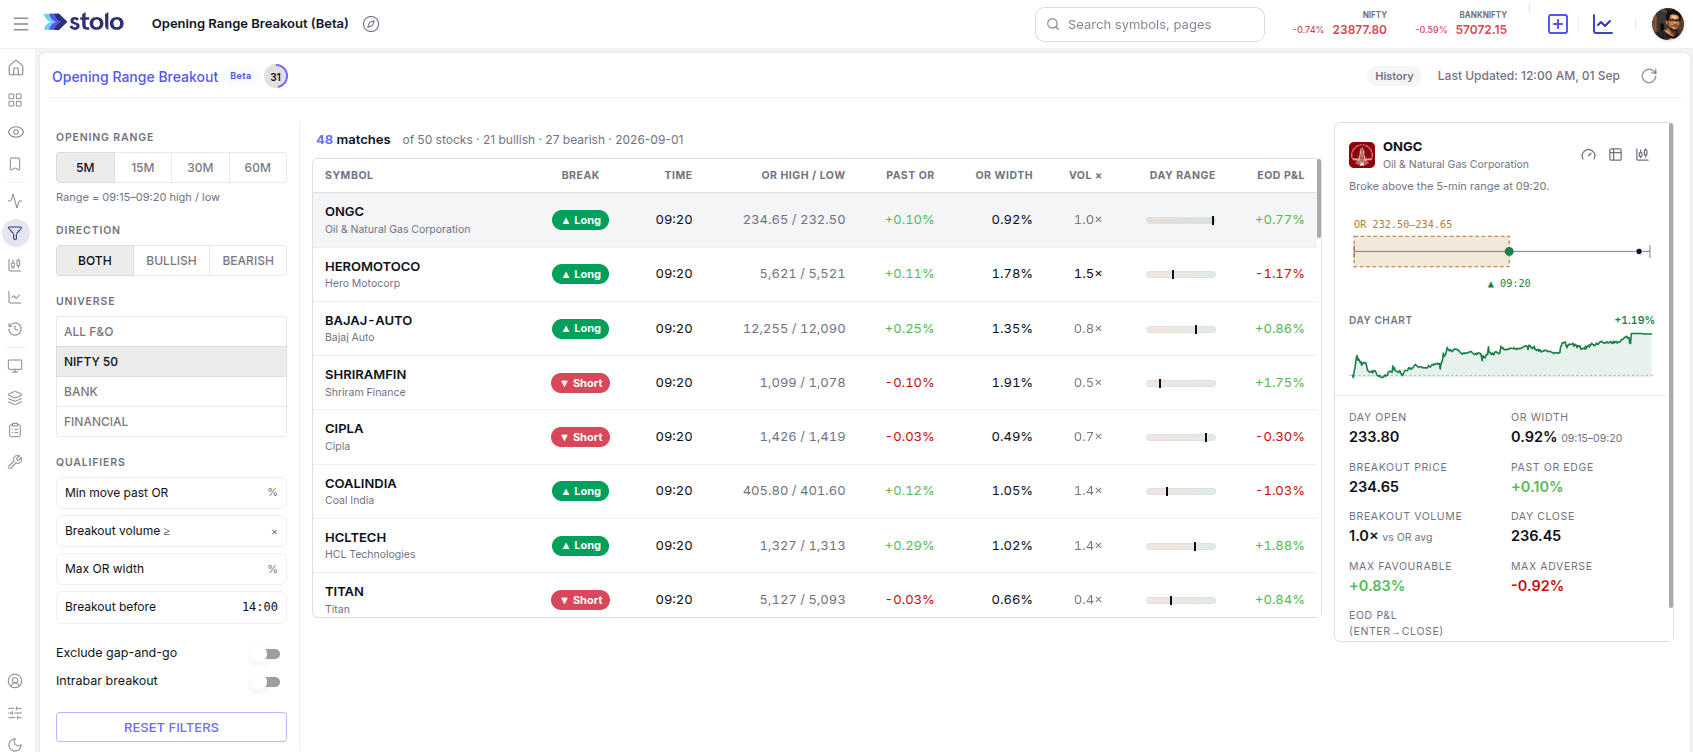
The opening range breakout is a proven intraday setup. Running it by hand across every F&O stock, in the busiest hour of the day, is impossible.
Tracking the opening range high and low on 180-plus F&O names before 9:30 is beyond any single screen.
By the time you spot a valid break on one chart, three others have already moved without you.
A breakout without a volume surge is easy to fade, but confirming that manually mid-session slows you down.
Stocks that opened outside yesterday's range pollute your list with gap continuation, not true intraday breaks.
You cannot tell whether a 15-minute range with a 2x volume filter actually has an edge without replaying past sessions.
After the fact, it is hard to separate the breakouts that ran into the close from the ones that whipsawed.
The opening range is the highest high and lowest low a stock makes in a fixed window from 9:15 AM, commonly the first 5, 15, 30 or 60 minutes. It acts as a line in the sand for the rest of the session.
An opening range breakout screener scans every F&O stock for the moment price closes decisively above that high (a bullish break) or below that low (a bearish break), then ranks the results by how clean the break was.
Read the Intraday GuideA tight range points to coiled indecision. A wide range means much of the day's travel may already be done.
The first candle to close beyond an edge is the signal. A break on rising volume that holds is the higher-quality one.
Breakout candle volume divided by the average opening-range candle volume. Above 1.5 to 2 signals real participation.
A close near the day's extreme means the move held. A close back in the middle means it reversed.
Stolo tracks the opening range on the whole universe and hands you the breakouts that already pass your rules, live or on any past date.
Pick the opening range length that fits your style and let the screener rebuild every range across the universe instantly.
Layer on quality filters so tiny pokes through a level and low-volume fakeouts never reach your list.
The results table gives you the full picture of each qualifying break at a glance.
Click any row to open a detail panel that draws the setup exactly as it played out.
Switch to history mode, pick a date, and the screener recomputes every opening range and breakout for that day.
Narrow the universe to run faster, and share a scan that reopens with the same settings.
Four states the screener helps you read once the opening range window has closed.
Price clears the opening range high by a clear margin with a volume ratio above 1.5 to 2. The market has resolved its early tug of war upward and often trends into the close. Traders look to enter near the range edge with a stop on the far side.
The first candle closes decisively under the opening range low with participation behind it. This is the mirror of the bullish case and tends to trend lower through the session. The range high or midpoint becomes the natural stop.
Price nudges past the edge on a volume ratio near 1, or the opening range is already very wide as a percentage of price. These breaks are easy to fade and often snap back inside. Tighten the minimum-move and maximum-width filters to drop them.
The stock broke one edge, failed, then broke the other, and the day-range position sits near 50. This is a whipsaw session for that name and a signal to stand aside or cut a position that is not working.
A repeatable morning workflow that turns the whole F&O universe into a short, ranked watchlist before 10:30.
Start Trial from ₹199Log in to Stolo, open Screeners from the main menu, and choose the Opening Range Breakout screener. It loads with NIFTY 50 and a short range so the first results appear quickly.
Choose a 15-minute opening range as your starting point, set direction to both, and widen the universe to All F&O once you are ready for a fuller scan.
Require a minimum move past the range so tiny pokes are ignored, and require a breakout volume ratio of 2 or more. These two do the most work in raising signal quality.
Turn on Exclude gap-and-go to focus on ranges that formed and broke within the session, and set breakout-before to 10:30 or 11:00 so you are not entering late.
Scan breakout time, distance past the range, volume ratio and day-range position. Click a row to see the opening-range band, the breakout marker and the closing dot on one chart.
Lock your filters, switch to history mode with the header date picker, and step through the last 20 to 30 sessions, totalling the EOD P&L column to get a rough read on the edge.
Three approaches traders mix up. Here is what each one actually surfaces.
A range that formed after 9:15 and then broke during today's trade, with volume and follow-through you can measure.
The stock opened well outside the previous day's range and simply kept running. There is no intraday range to break.
Top gainers, losers and unusual volume lists tell you what moved, but not whether a defined level was broken or when.
The Stolo edge: the opening range, breakout time, volume ratio and day-range position are computed directly from one-minute NSE data across every F&O stock, not approximated. Pair it with the market screener for broader context or support and resistance levels for confluence.
Run Your First ScanHow Stolo compares to broker platforms and generic screeners for running the ORB strategy in India.
| Feature | Stolo | Broker platforms | Generic screeners |
|---|---|---|---|
| Opening range computed for every F&O stock | |||
| Selectable 5, 15, 30, 60 minute range | Manual | ||
| Breakout volume ratio versus range average | Raw volume only | ||
| Exclude gap-and-go opens | |||
| Day-range position score for follow-through | |||
| History mode with simulated EOD P&L | Limited | ||
| Shareable scan URL with saved filters | Partial | ||
| NSE-authorised real-time data feed | Often delayed |
Discuss setups with other intraday traders on the Stolo Telegram channel.
FAQ
Direct answers to the most-searched questions about the opening range breakout screener, the ORB strategy in India, and intraday breakout scanning on NSE
Trader Voices
Every trade is a small bet on a dream, backed by risk and a decision you have to own. Stolo is built for traders who bring purpose and discipline to that decision, not just numbers.

My first impression of your site, "K.I.S.S."..... Simple yet effective...uncluttered and has all the ingredients a trader actually needs not the nonsensical ones... great job
These are unedited testimonials from traders in our Telegram community. Photos shown are AI-generated and used for representation only.

You have something unique in your platform that has changed my trading. I have used Quantsapp earlier didn't find it useful. I have tried opstra, sensibull etc.
These are unedited testimonials from traders in our Telegram community. Photos shown are AI-generated and used for representation only.

Dear Sir, I am really impressed with the user interface and multiple other facilities for option traders.
These are unedited testimonials from traders in our Telegram community. Photos shown are AI-generated and used for representation only.
Got a question or a feature you wish existed? Drop it in our Telegram community, the Stolo team is right there reading every message.