Index Analysis: NIFTY, BANKNIFTY and FINNIFTY
Indices set the market narrative, but the number on the screen hides who is moving it. Stolo's Index Analysis gives you two levels: a real-time overview of every major index on one screen, and, for any index you open, the constituents driving its move.
The problem it solves
Most traders check the index level and stop there. They cannot tell whether NIFTY is rising with strength or drifting up weakly, which stocks are contributing, or whether the indices agree or diverge. Answering that on a typical platform means several pages. Index Analysis combines the index charts, OHLC and constituent performance into one dashboard.
What the view shows
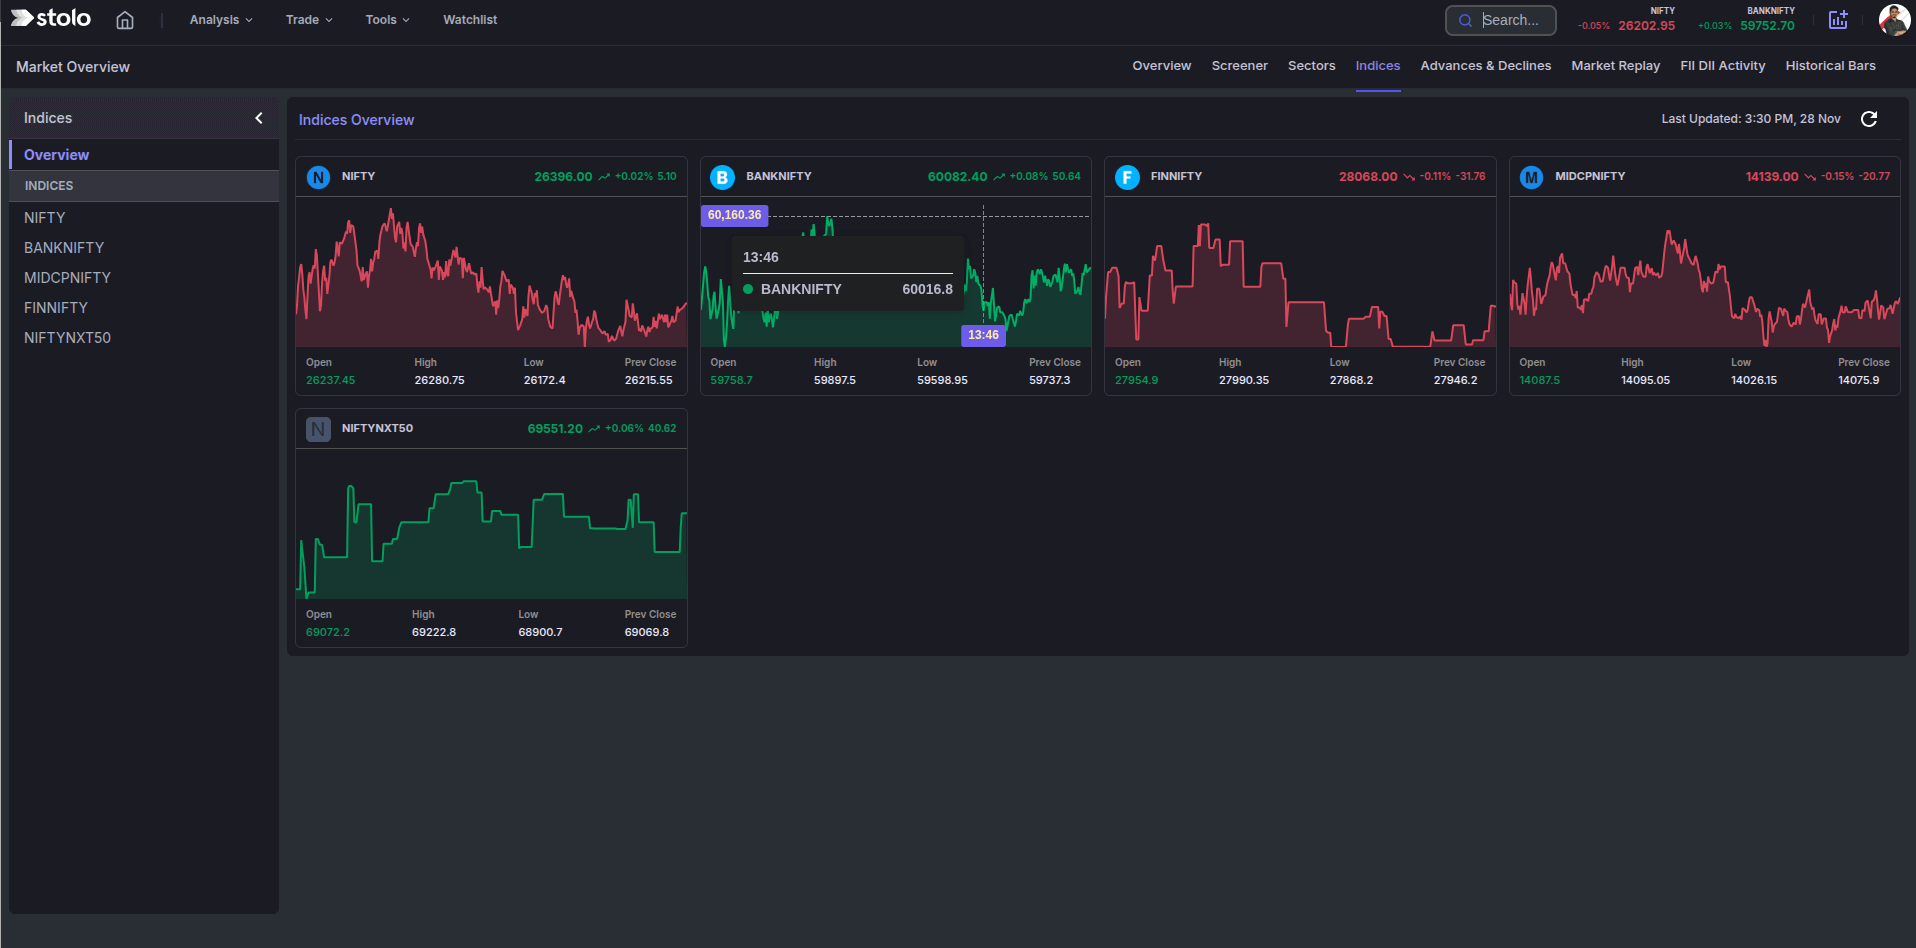
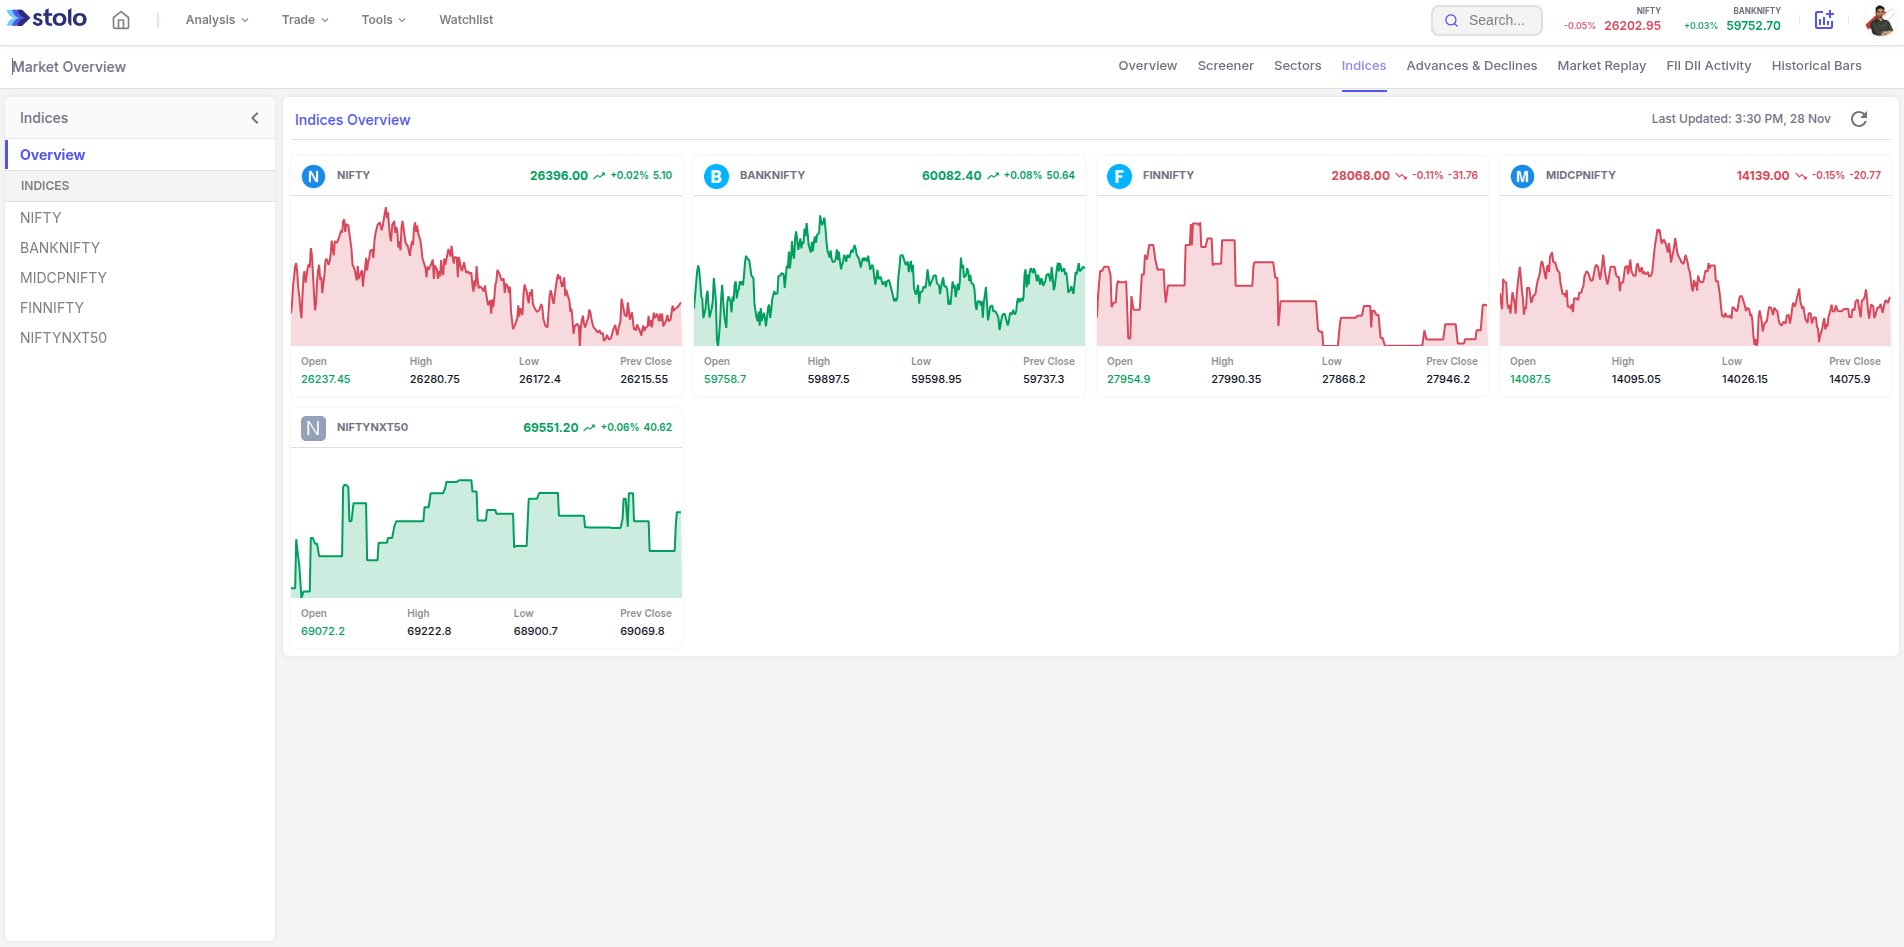
Indices Overview
- Real-time intraday charts for NIFTY, BANKNIFTY, FINNIFTY, MIDCPNIFTY and NIFTYNXT50.
- OHLC values and percentage change for each.
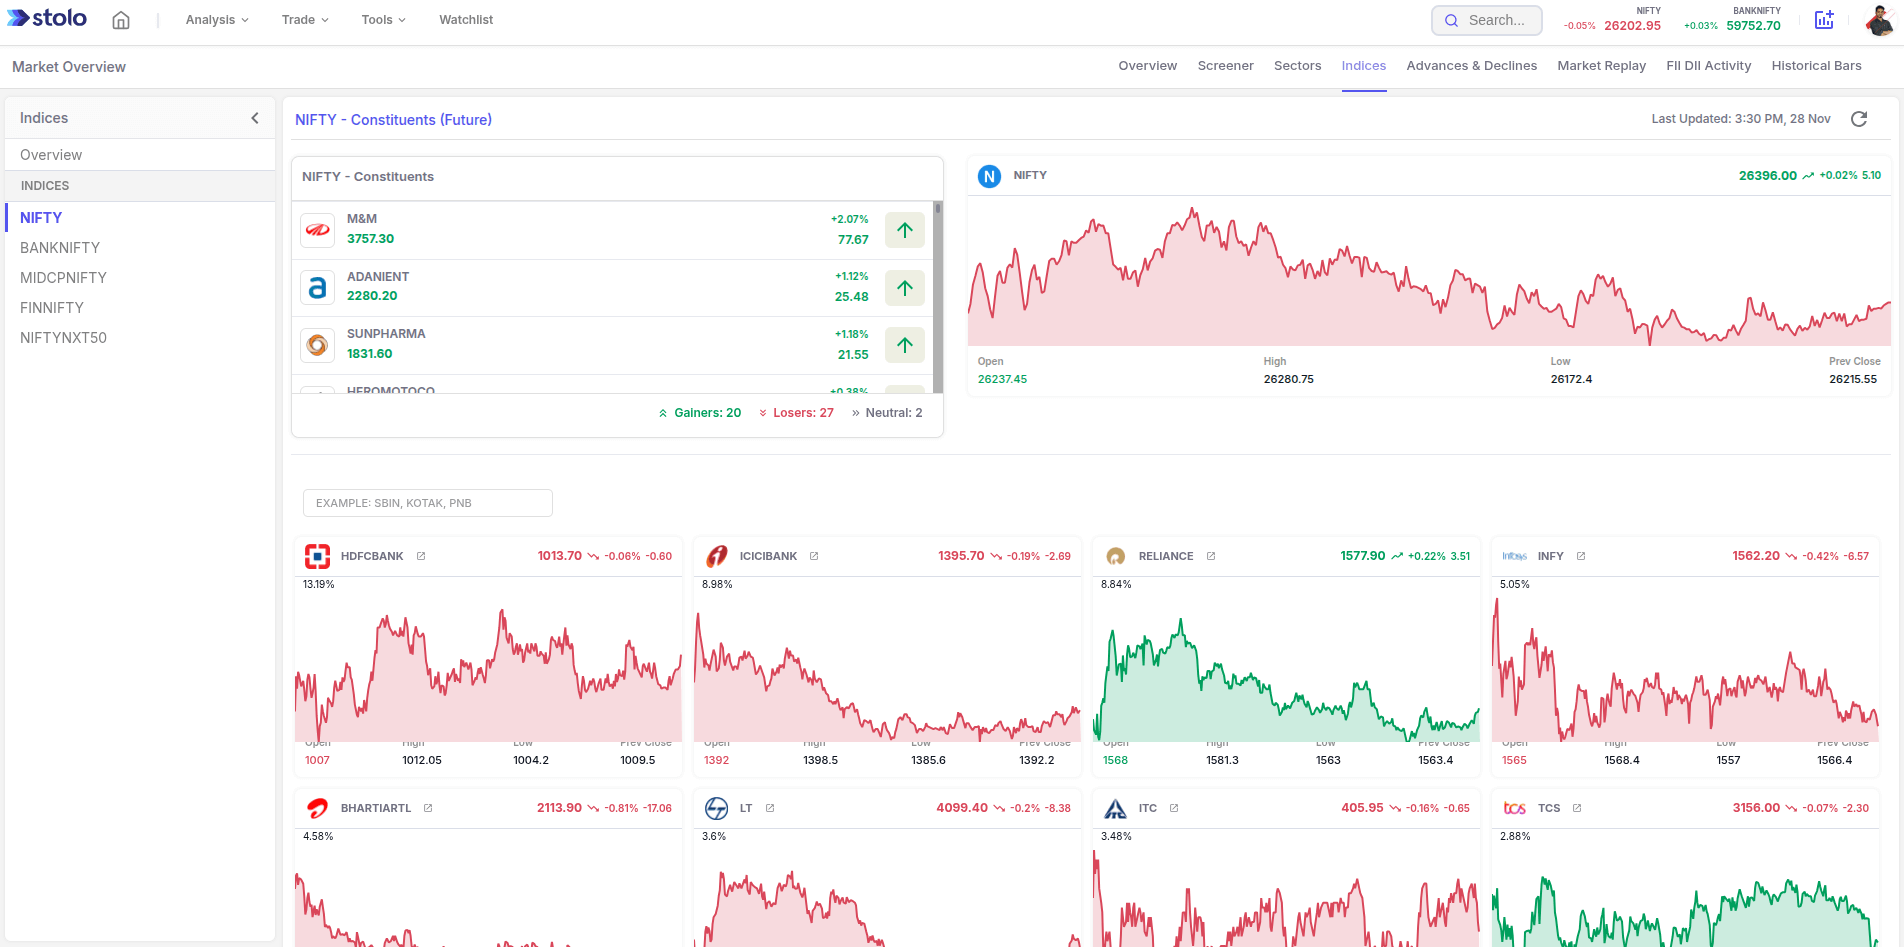
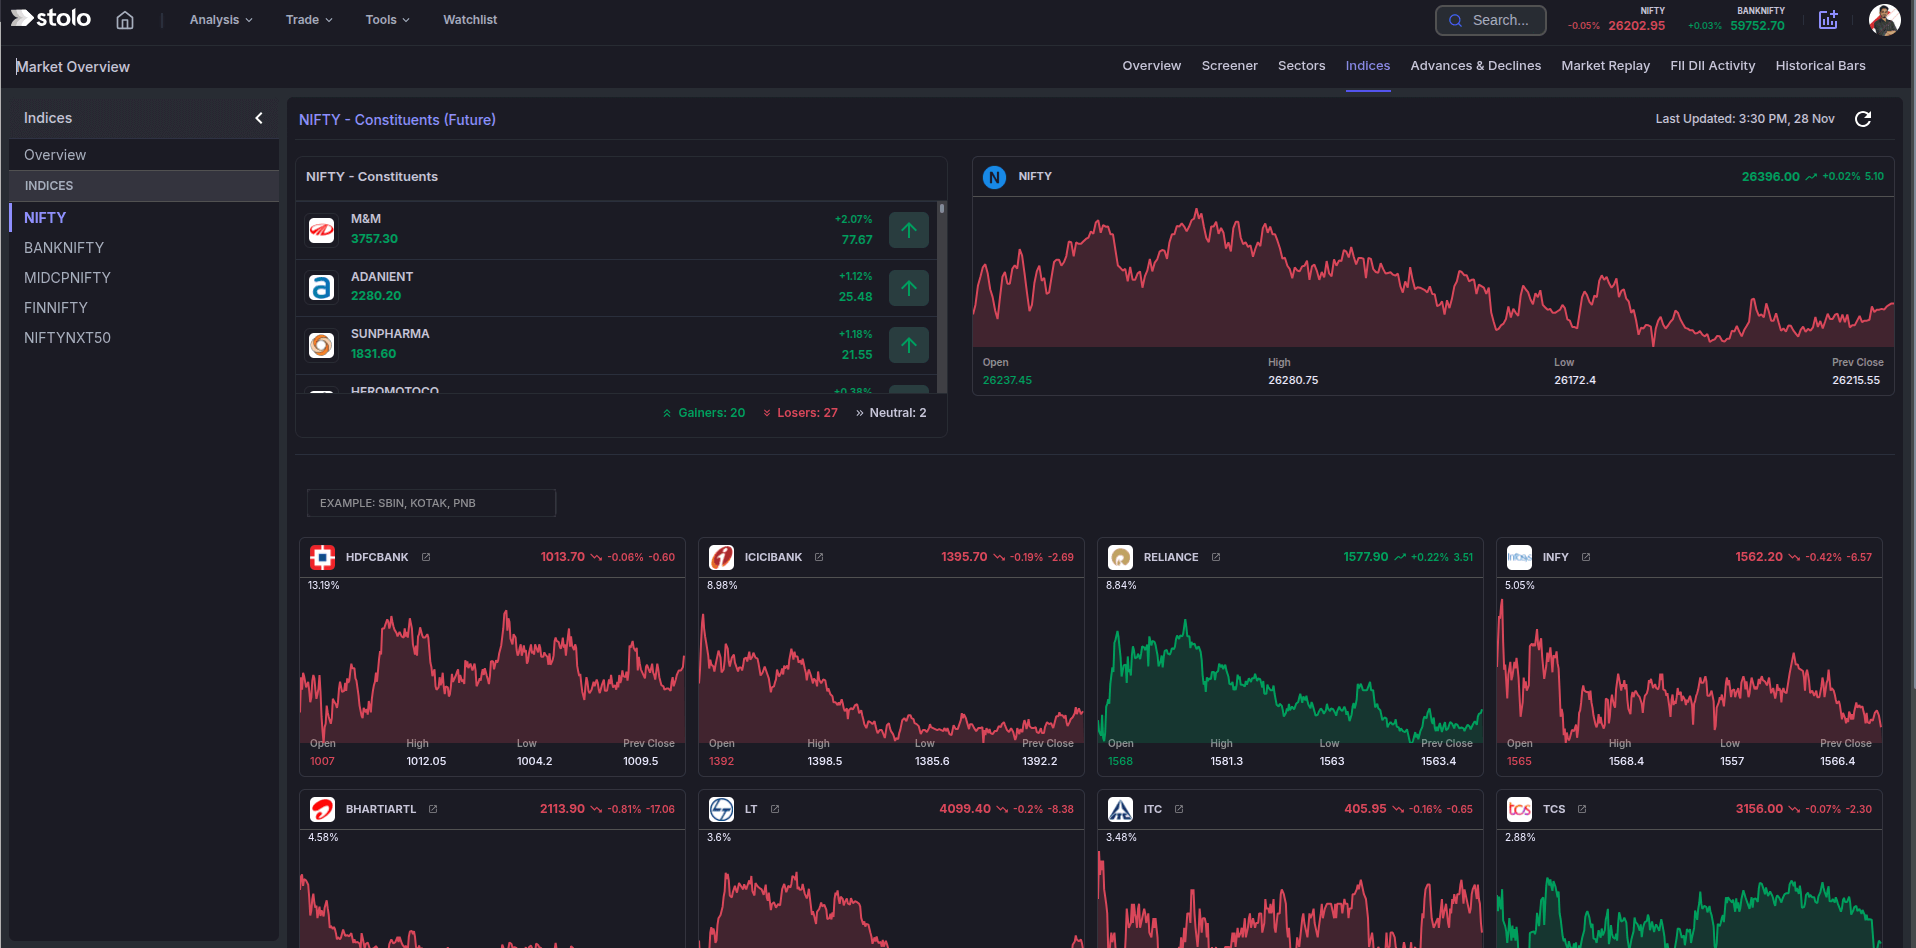
Specific index view
- A gainers and losers panel for that index's constituents.
- A mini intraday chart for each constituent stock.
- Contribution context, so you see which names are moving the index.
- A search bar to find a specific constituent.
Key terms explained
| Term | What it means |
|---|---|
| Constituent | A stock that is a member of the index. |
| Weight | How much of the index a stock represents. |
| Contribution | The stock's share of the index's points move on the day. |
| Breadth | How many constituents move with the index versus against it. |
| Divergence | Two indices moving opposite ways, showing where strength sits. |
A worked example
At 11:00 the Indices Overview shows NIFTY up 0.5 percent but BANKNIFTY down 0.3 percent.
- You open NIFTY. The gainers panel is led by RELIANCE and INFY, both high-weight, both trending up cleanly.
- Bank constituents are mixed to red.
The read: the NIFTY move is real but it is an Energy and IT story, not a broad-market one, and financials are a drag. A trader takes a long in a strong IT or Energy name rather than the index, and avoids BANKNIFTY longs entirely while it diverges.
How to use it in Stolo
Index Constituents Analysis in Stolo
- Open Analysis, then Indices Analysis under the Market Sentiment section.
- Read the Overview for the direction of every major index and whether they agree.
- Open an index to see its constituents.
- Read the gainers and losers panel and the constituent mini-charts to see whether the move is broad.
- Use the search bar to check a specific heavyweight.
- Decide whether to trade the index or a leading constituent based on the breadth.
When two heavyweights are driving the whole index move, trade those names directly. Their charts are cleaner and you are not diluted by the rest of the basket.
How traders use it
- Breadth check. Only trust an index breakout confirmed by broad constituent participation.
- Trade the leader. If a couple of names are carrying the index, trade them instead.
- Divergence read. NIFTY up while BANKNIFTY is down tells you where to be long and where to avoid.
- Catch-up trades. A laggard in a strong index can be a catch-up long.
Frequently asked questions
What does Index Analysis in Stolo show?
Why look at index constituents instead of just the index?
How do I see which stocks are driving the index?
What does it mean when indices diverge?
Does Index Analysis update in real time?
Can I search for a specific stock inside an index?
How is this different from the Market Heatmap?
How does Index Analysis help before trading options?
Which indices are covered?
Which plan includes Index Analysis?
See what is really moving the index
Open Stolo's Index Analysis for a live overview of every major index and the constituents driving each move.
Start with a Flexi Trial from ₹199