Market Screener for F&O: Price, OI, PCR and IV
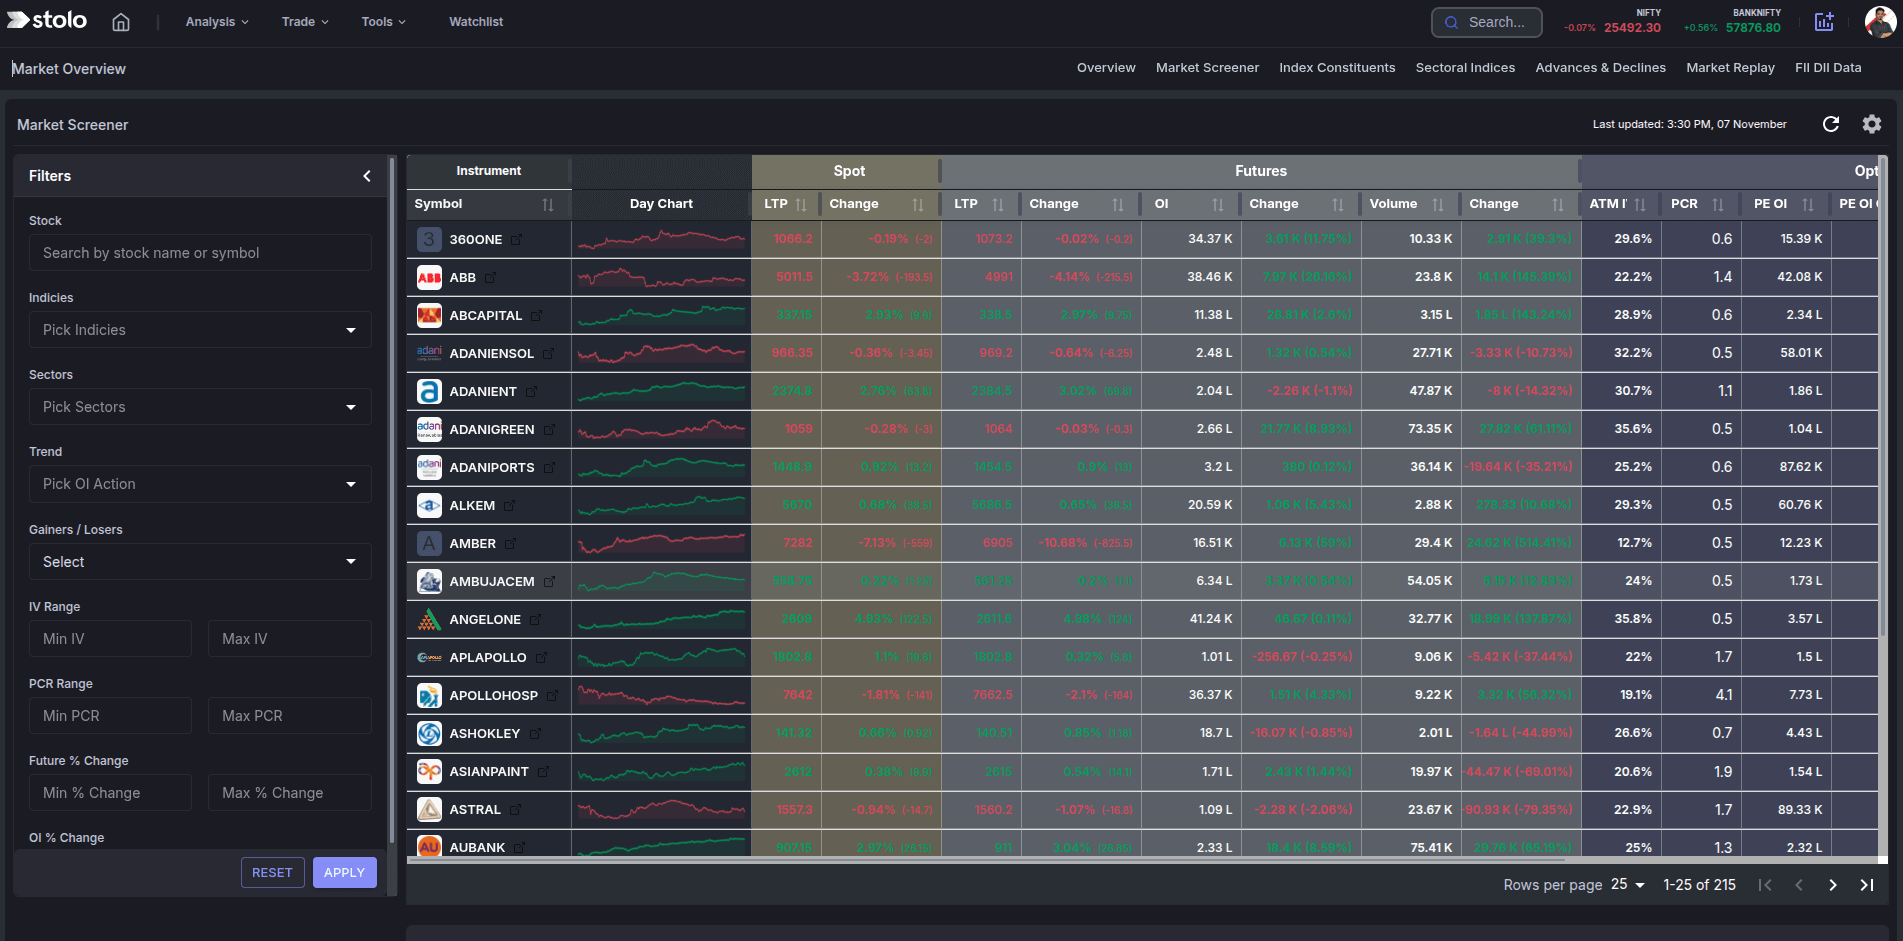
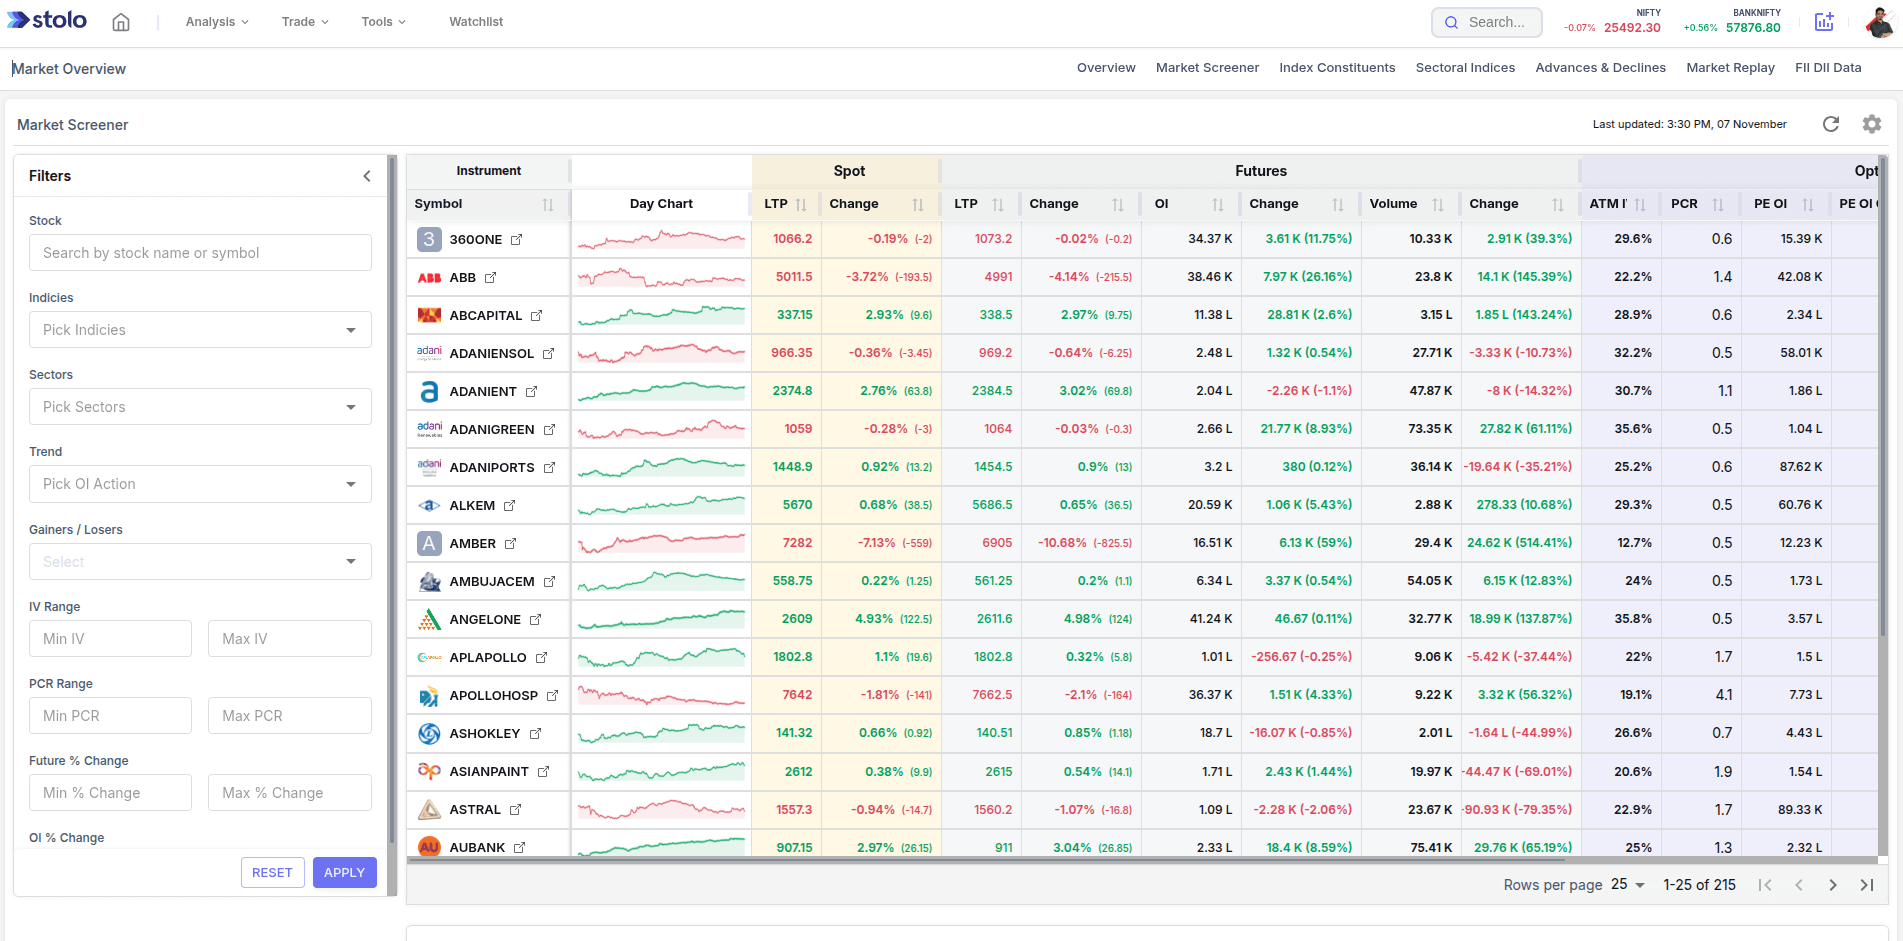
Instead of switching between ten tools to check which stocks are trending, where open interest is building, which sectors are strong and what the IV and PCR are, Stolo's Market Screener puts all of it in one filterable dashboard. Every F&O instrument as a row, with its price, futures and options data, and a set of filters that narrow the whole market to the setups you want in seconds.
Market Screener Analysis in Stolo
The problem it solves
The F&O list runs well past 180 stocks plus the index names. Checking each one for a price move, an OI build and a supportive PCR by hand is impossible, so most traders watch the same fifteen names and miss the rest. The screener checks every instrument on every refresh and, once you stack a couple of filters, hands you a short list where more than one signal agrees.
What the screener shows
| Group | Fields |
|---|---|
| Price (spot) | LTP, percentage change, sector and index mapping, mini intraday sparkline |
| Futures | LTP, percentage change, open interest, volume |
| Options | ATM strike, PCR, ATM IV, call OI and change, put OI and change |
| Sentiment | The OI buildup trend label for the instrument |
The filters
- Index and sector.
- Gainers or losers.
- Trend: long buildup, short buildup, long unwinding, short covering.
- IV range.
- PCR range.
- Futures percentage change range.
- OI percentage change range.
- Stock name.
Key terms explained
| Term | What it means |
|---|---|
| Buildup trend | Price and OI combination: long buildup, short buildup, unwinding, covering. |
| PCR | Put OI divided by call OI for the instrument. |
| ATM IV | Implied volatility of the strike nearest the price. |
| Sparkline | The mini intraday chart in each row. |
| Futures percentage change | The day's move in the futures contract, the cleaner momentum read than spot. |
A worked example
It is 10:15. You want the day's cleanest bullish setups.
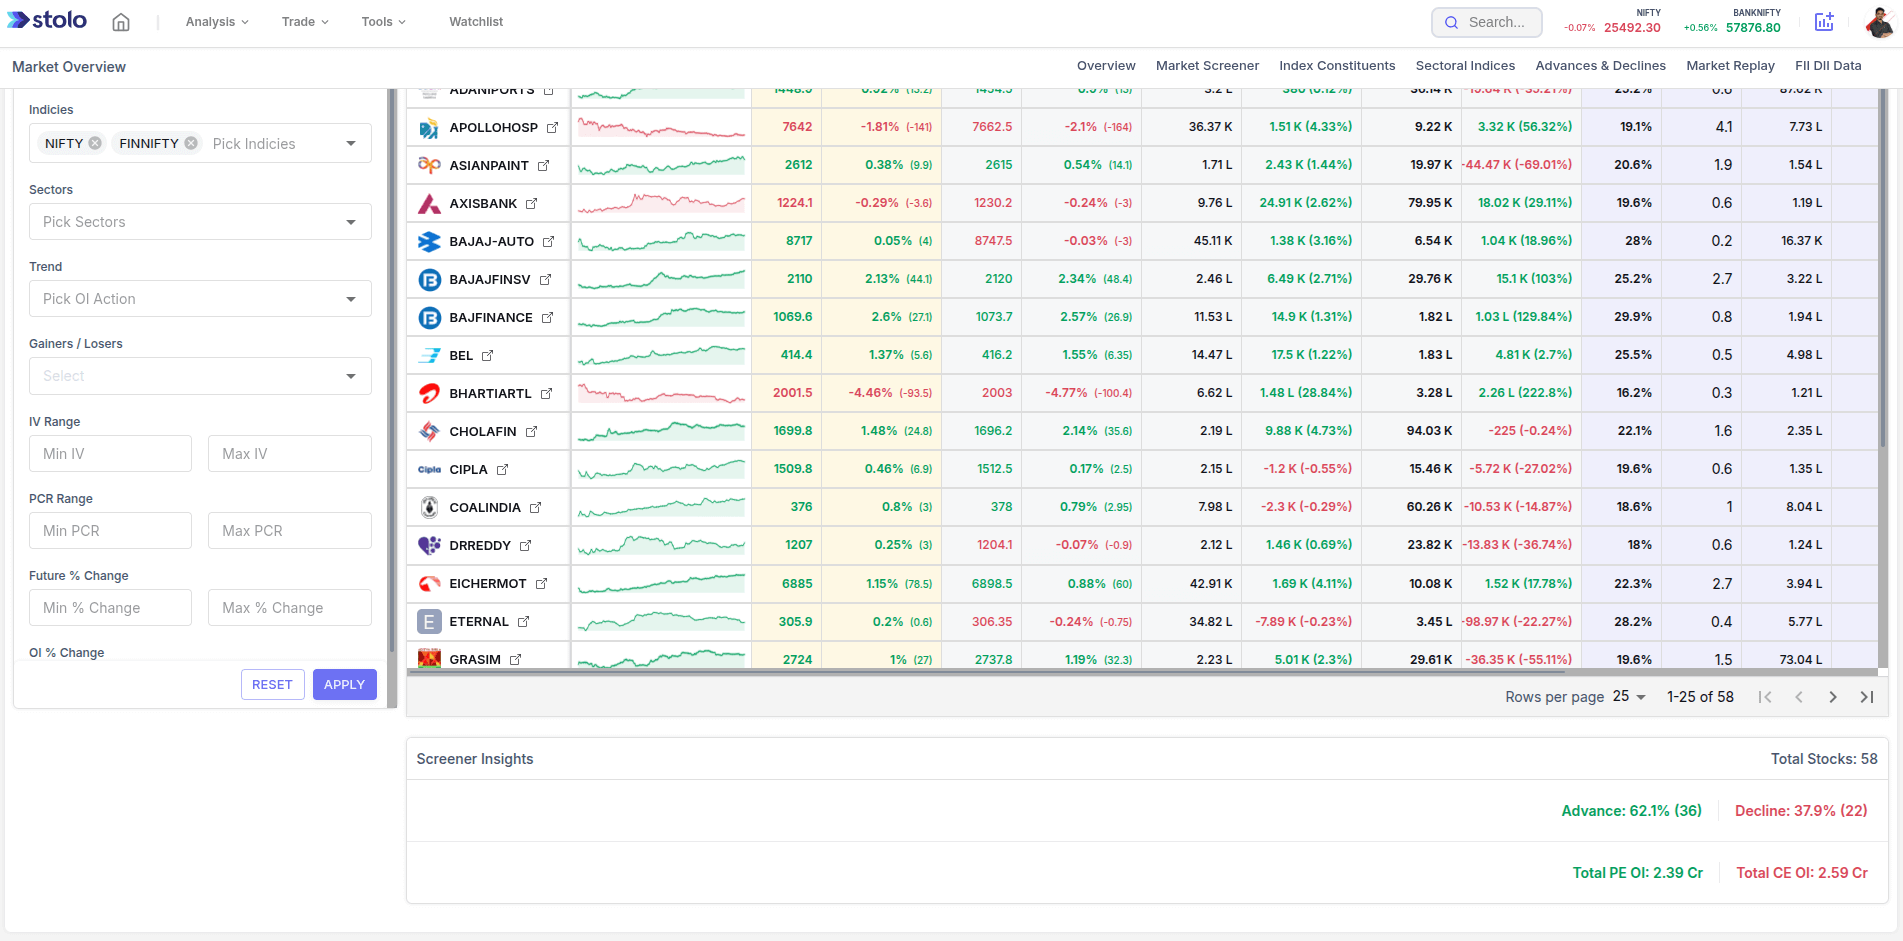
- Filter: gainers, futures percentage change above 1.5, trend long buildup, PCR above 1.
- Six names come back. You sort by futures percentage change.
- The top one is a metals stock, up 2.4 percent, OI up 18 percent, PCR 1.3, IV steady.
The read: fresh longs, put writers supporting, no volatility drag. You click the row to open the instrument, check the option chain and open interest for the strike-level picture, and set an alert while you wait for a pullback to enter.
How to use it in Stolo
- Open Analysis, then Market Screener under the Market Sentiment section.
- In the filters panel, pick your conditions: sector or index, gainers or losers, trend, IV, PCR and the change ranges.
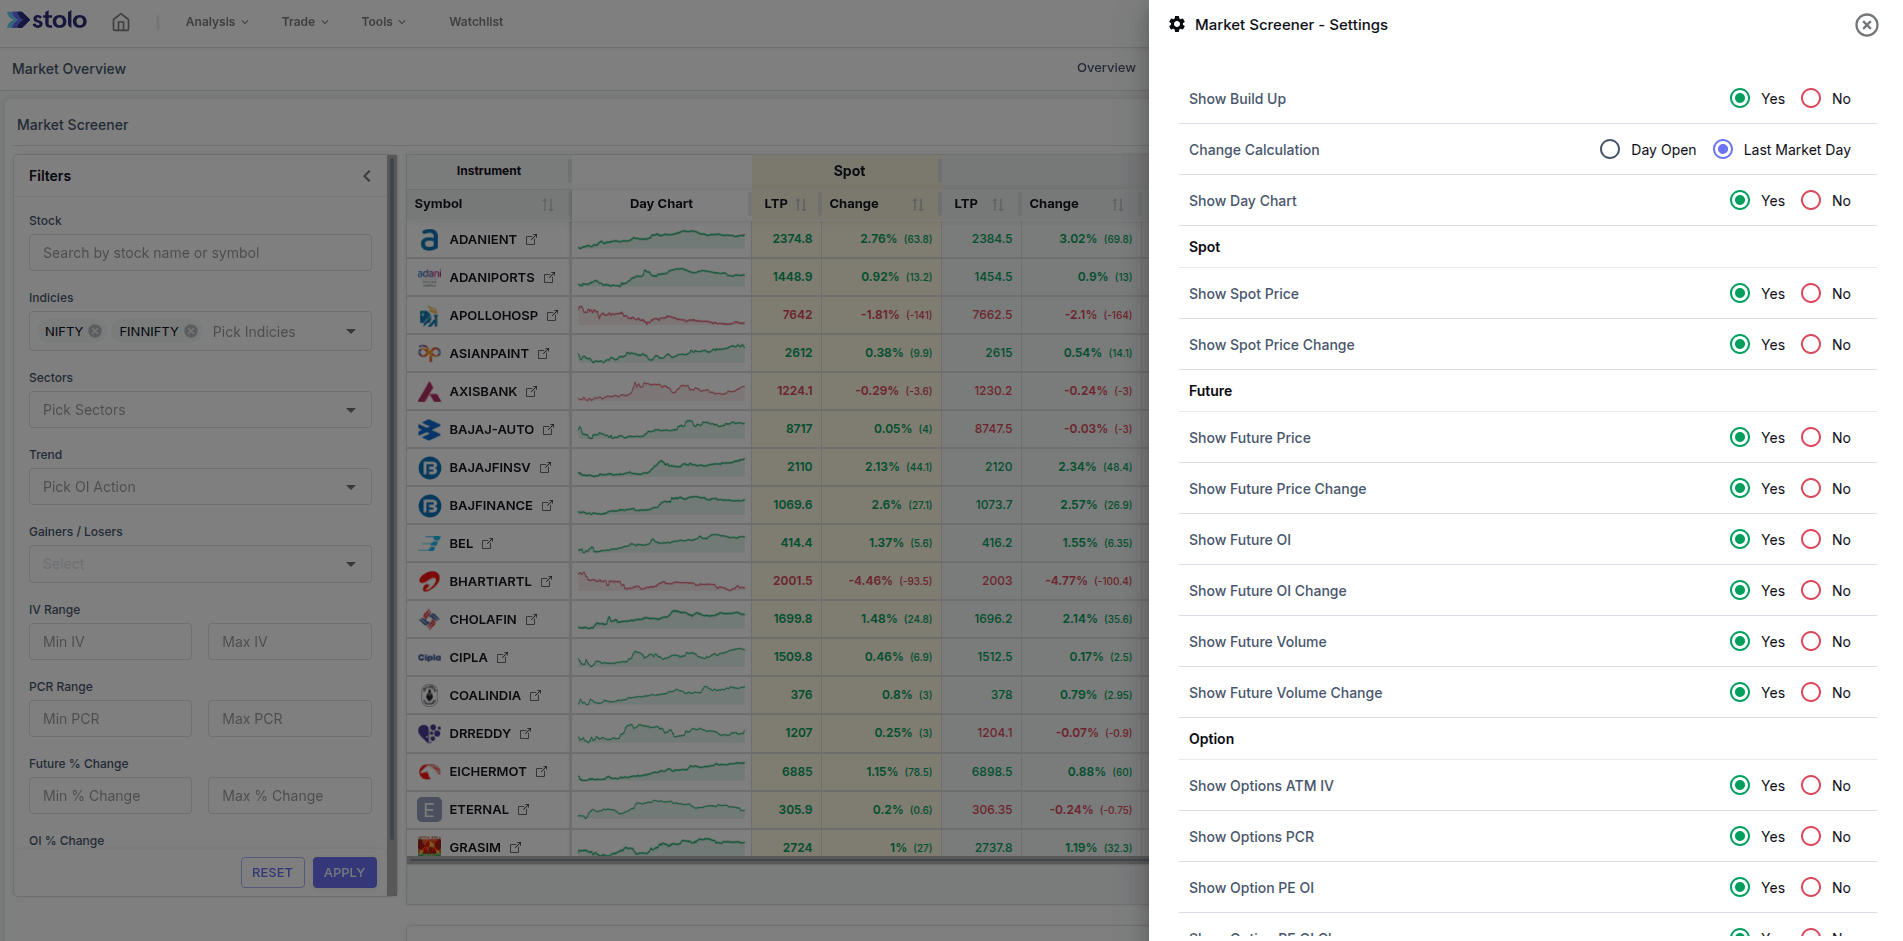
- Read the results table: sparkline, spot and futures data, OI and volume, sentiment, and option-side OI flows.
- Sort by the column that matters for your setup, usually futures percentage change or OI percentage change.
- Click any row to open that instrument for deeper analysis.
- Set market alerts on the names you keep.
The screener is a research tool. Stolo does not place trades. It surfaces candidates; you confirm and execute through the option chain or your connected broker.
How traders use it
- Momentum leaders. Gainers, high futures change, rising OI, sorted by futures change.
- OI setups. A buildup trend filter plus a PCR range, so positioning and sentiment agree.
- Reversals. Short covering or long unwinding labels for a fade shortlist.
- Sector rotation. Pick a sector and sort by price change to see the group's trend at a glance.
Frequently asked questions
What data does the Market Screener show?
Which filters can I use?
How do I use it to find momentum leaders?
How do I find OI-based setups?
Can I spot reversals with the screener?
Does the Market Screener update in real time?
Can I combine several filters at once?
How is this different from the IV Rank or ORB screener?
Does it cover stocks and indices both?
Which plan includes the Market Screener?
Scan the whole F&O market in seconds
Open Stolo's Market Screener and filter price, OI, PCR and IV to find the day's setups across every F&O instrument.
Start with a Flexi Trial from ₹199