How to Read an Option Chain
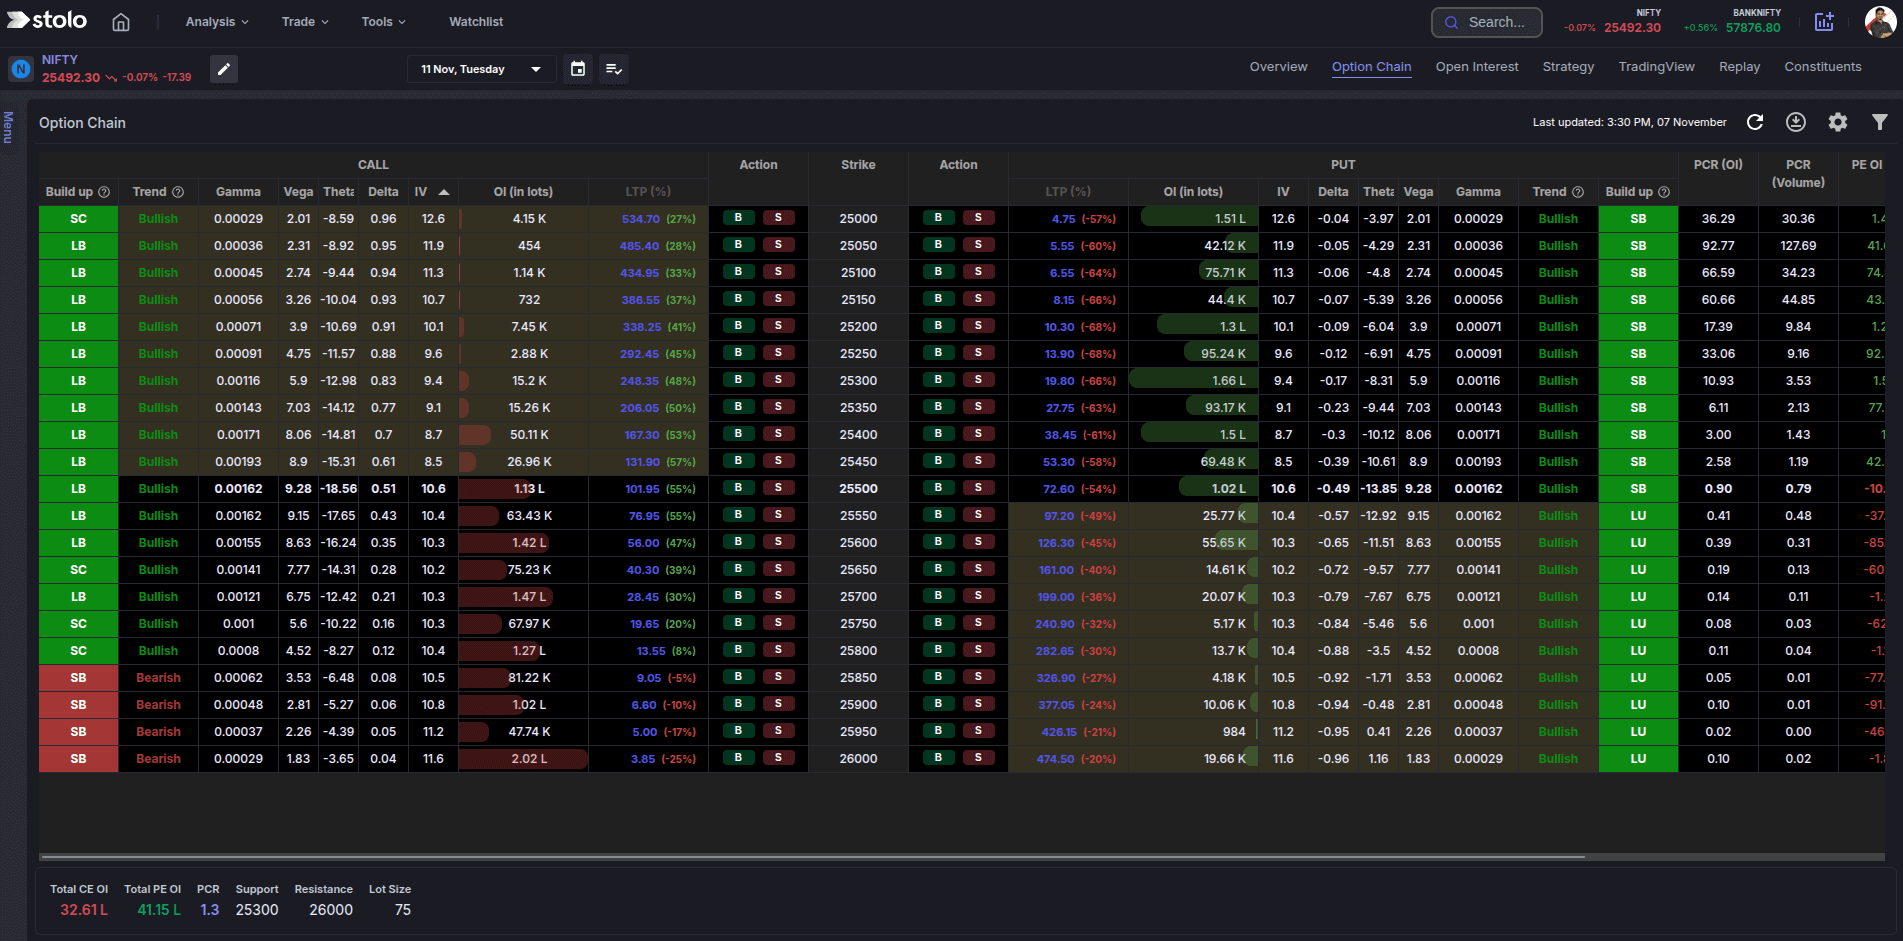
The option chain looks like a wall of numbers, but it is the single richest sentiment picture in the market. Every strike tells you what traders are doing: where they are writing calls, where they are writing puts, where fresh money is going and where it is leaving. Stolo turns that table into a colour-coded, real-time view with buildup tags, so the story on the chain is readable at a glance.
Option Chain in Stolo
The problem it solves
On a broker terminal the chain is raw text: price, OI, IV, volume, no context. You cannot tell whether the call OI at 22,100 is being built or unwound, whether today's IV is high for this name, or which strikes actually matter. Stolo adds the change columns, the buildup classification and colour coding so the chain reads like a chart instead of a spreadsheet.
How the chain is laid out
- Strikes down the middle. From deep in the money to deep out of the money.
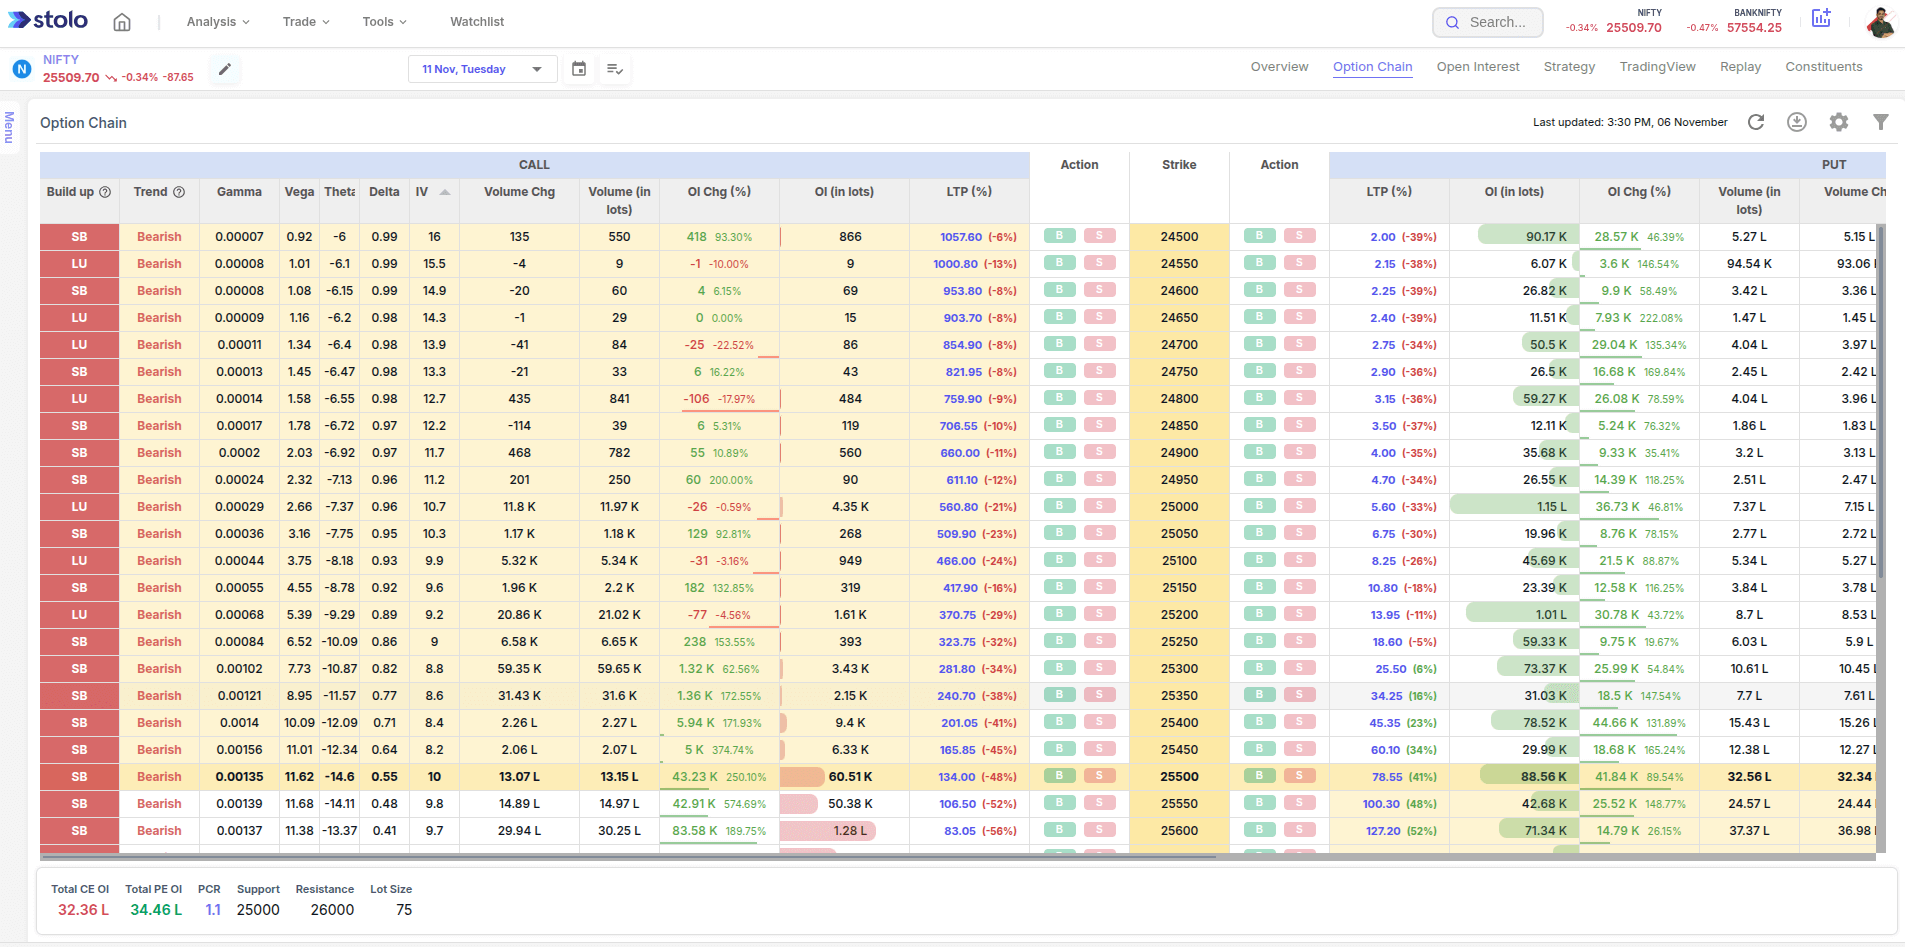
- Calls on one side, puts on the other. Each with its own price, IV, OI, change in OI and volume.
- The ATM row is highlighted. The strike nearest the current price. In-the-money and out-of-the-money rows shade away from it.
- Read across a strike. Compare the call and put activity at the same level to see which side is defending it.
Key terms explained
| Term | What it means |
|---|---|
| Strike | The price at which the option can be exercised. |
| LTP | Last traded price of the option, its premium. |
| IV | Implied volatility, the expected move the market is pricing in. |
| OI | Open interest, total open contracts at that strike. |
| Change in OI | How OI moved over the chosen interval. The key signal. |
| ATM / ITM / OTM | At, in and out of the money relative to the current price. |
| Buildup | The premium and OI combination: long buildup, short buildup, unwinding, covering. |
| Skew | The pattern of IV across strikes, usually higher for OTM puts. |
How to read sentiment from it
- Find the walls. The strikes with the largest call and put OI. The call wall is resistance, the put wall is support, and together they frame the expected range.
- Watch the change columns. Fresh call OI being added above price is new resistance. Fresh put OI below price is new support. Fresh unwinding at a wall means the level is weakening.
- Read the buildup tags. A run of short-buildup call strikes above price is a market that expects a cap; a run of short-buildup put strikes below is a market that expects a floor.
- Check the skew. A steep OTM put skew means the market is paying up for downside protection, a cautious sign even on a green day.
A worked example
NIFTY is at 22,050, one day to weekly expiry.
- 22,100 CE: OI up 35 percent today, premium falling. Buildup tag: short buildup. Resistance.
- 22,000 PE: the largest put OI on the chain, stable. Support.
- 21,900 PE: OI rising fast in the last 15 minutes, premium falling. Fresh support forming lower.
The chain says the market is boxed between 21,900 and 22,100 by writers positioning for an expiry pin near 22,000. A trader might sell the 21,900 to 22,100 strangle, then watch the change columns: if 22,100 CE OI starts unwinding while price pushes up, the call side needs managing.
How to use it in Stolo
- Open Analysis, then Options, then Option Chain.
- Choose the instrument, for example NIFTY or BANKNIFTY, and the expiry.
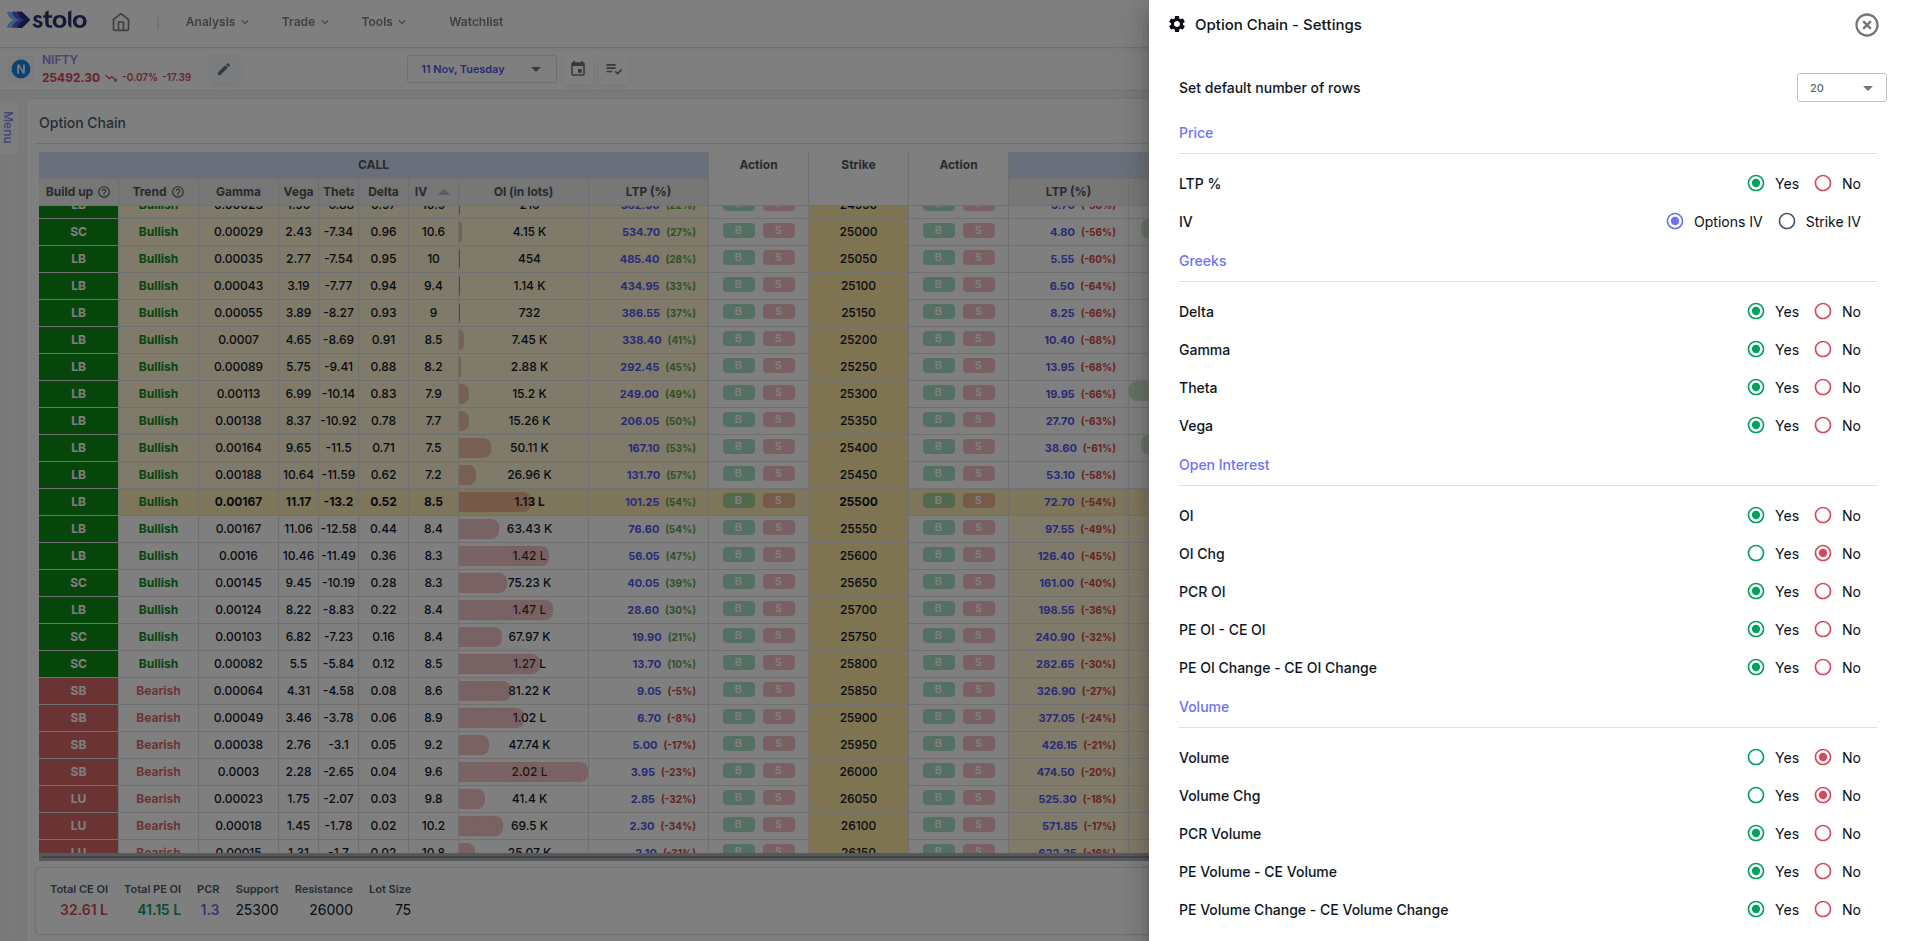
- Set the columns you want from settings: keep it to LTP, IV, OI and change in OI for a quick read, add the Greeks when pricing a position.
- Pick the time interval for the change-in-OI columns.
- Read the buildup tags and the OI walls to map support, resistance and the expected range.
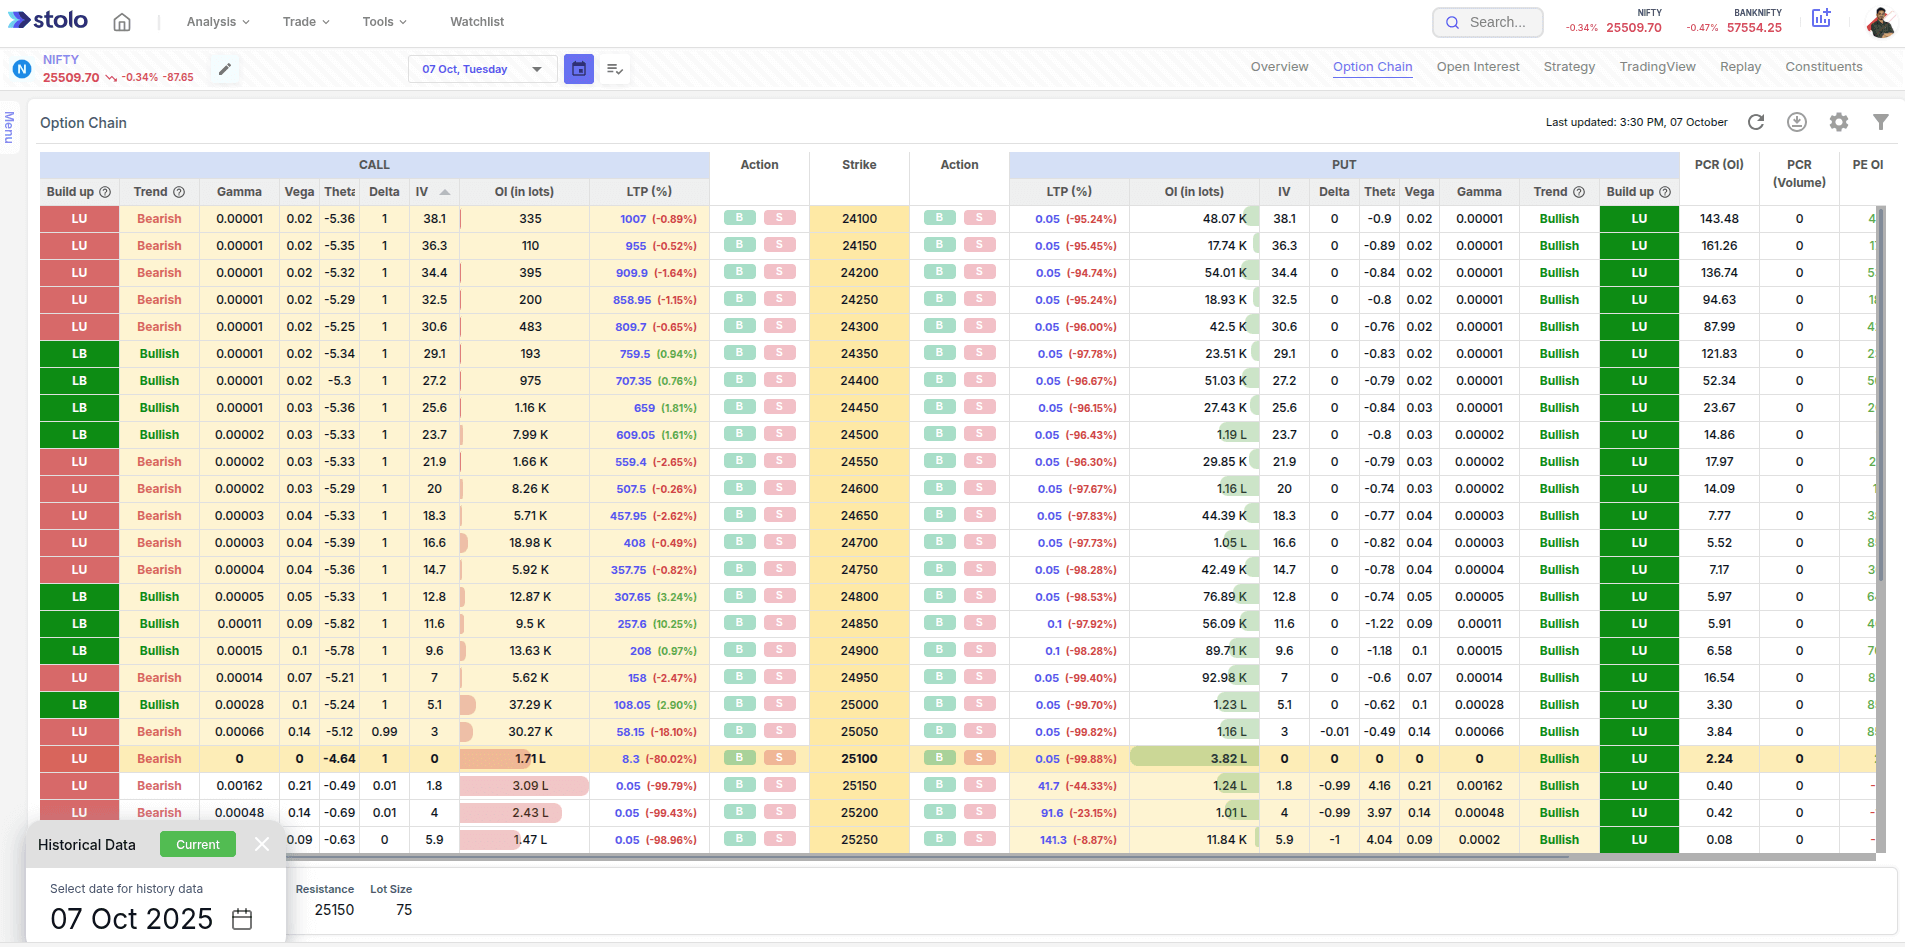
- To view history, click the calendar icon next to the expiry and choose a past date.
Put the change-in-OI view next to a price view. OI change plus price direction is what gives you the buildup type, and that is the actionable read.
Live mode and history mode
Live mode streams the chain through the session. History mode loads the chain as it stood on a past date, so you can study how positioning built into a previous expiry or event and recognise the pattern.
Frequently asked questions
What is an option chain?
How do I read sentiment from the option chain?
What is the difference between OI and change in OI?
What does the buildup classification on the chain mean?
Can I customise the columns on Stolo's option chain?
Does Stolo show a live option chain?
Can I view a historical option chain?
What is implied volatility on the chain?
Do I need to understand the Greeks to use the option chain?
Which plan includes the option chain?
Read the market the smart way
Open Stolo's colour-coded option chain with buildup tags and customisable columns, live or on any past date.
Start with a Flexi Trial from ₹199