Cumulative OI Analysis for NIFTY and F&O Options
Cumulative OI analysis in Stolo adds up the open interest across the strikes you select and plots total call OI against total put OI over the session, alongside price and the put-call ratio. It is the market-wide sentiment view: rather than reading positioning strike by strike, you see whether the option market as a whole is leaning bullish or bearish and when that lean last changed.
Cumulative OI Analysis in Stolo
The problem it solves
Strike-level OI is detailed but noisy. To judge overall sentiment you have to sum it in your head across a dozen strikes and track how that sum is changing. Cumulative OI does the arithmetic and plots it, so the net call and put buildup, the PCR and the intraday trend are all one glance instead of a mental spreadsheet.
The concept
- Sum the OI. Add every selected strike's call OI into one total and every put OI into another.
- Plot against price. Two OI lines and the price line on one time axis.
- Read the divergence. Which total is growing faster tells you which side is writing more, and the PCR line makes that a single number.
- Watch the flip. When cumulative OI and price stop moving together and start to diverge, sentiment is turning, and Stolo marks the time it last did.
Key terms explained
| Term | What it means |
|---|---|
| Cumulative call OI | Total open interest across all selected call strikes. |
| Cumulative put OI | Total open interest across all selected put strikes. |
| PCR | Cumulative put OI divided by cumulative call OI. |
| Net buildup | Whether calls or puts are being added faster on the session. |
| Intraday trend | Stolo's computed read of the option market's directional lean. |
| Reversal time | The clock time at which that trend last flipped. |
| Strike band | The range of strikes included in the totals, which you set. |
A worked example
BANKNIFTY opens at 48,000. You select the strikes from 47,000 to 49,000 and set a 5-minute interval.
- Through the first hour, cumulative put OI climbs steadily while cumulative call OI is flat. PCR rises from 0.9 to 1.25. The trend reads bullish. Price grinds up to 48,300.
- At 11:20 the reversal marker appears: cumulative call OI starts rising sharply and PCR turns down. Price stalls at 48,350.
The read: put writers drove the morning rally, then call writers stepped in around 48,400 and capped it. A trader who was long from the open now has a reason to book, and a fade trader has a signal to sell the 48,400 call into that fresh writing.
How to use it in Stolo
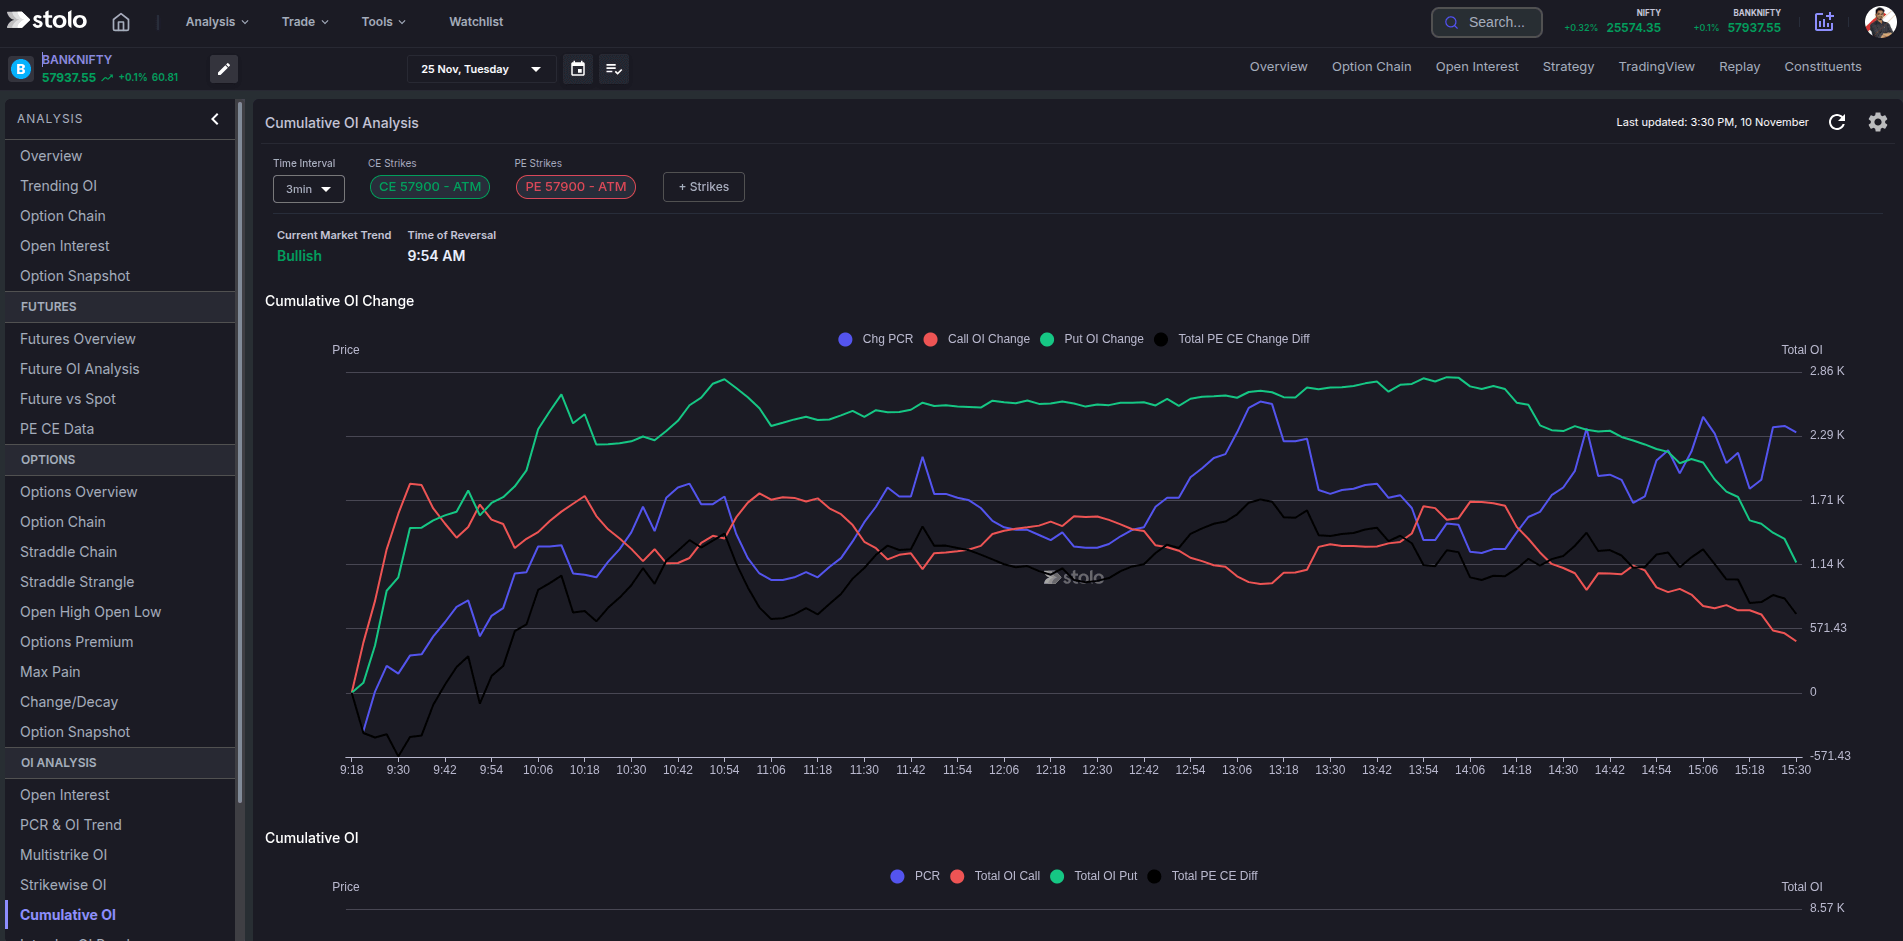
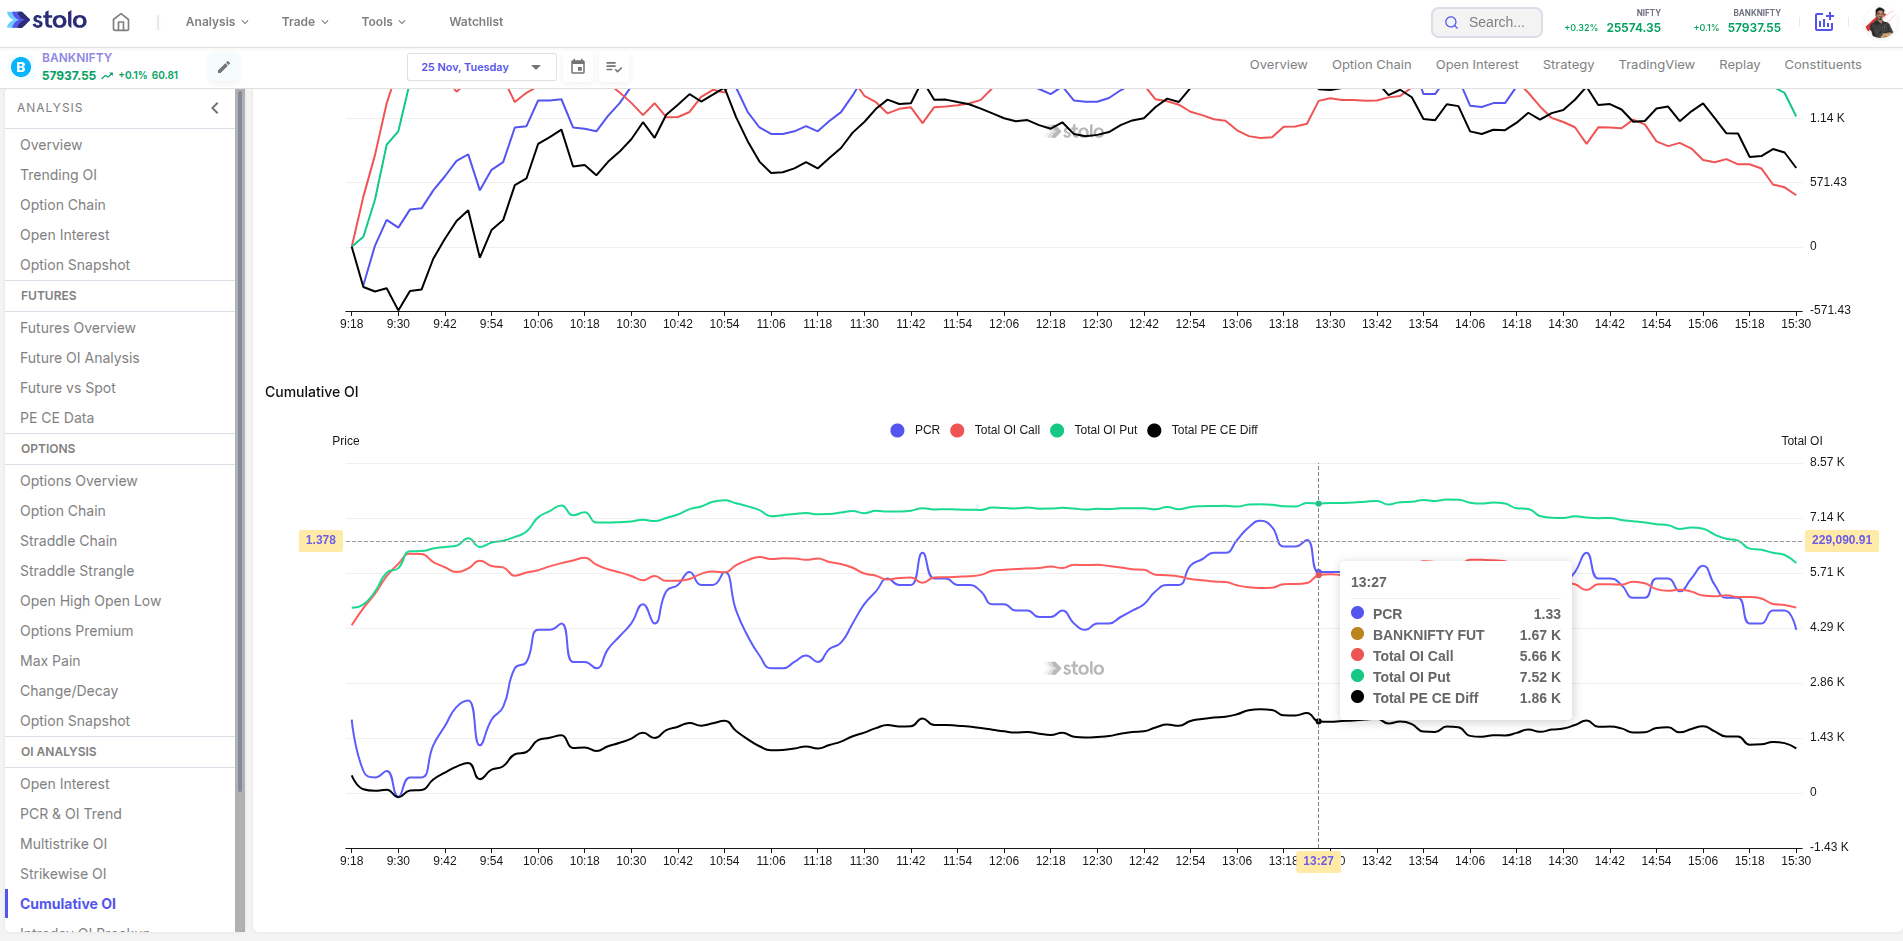
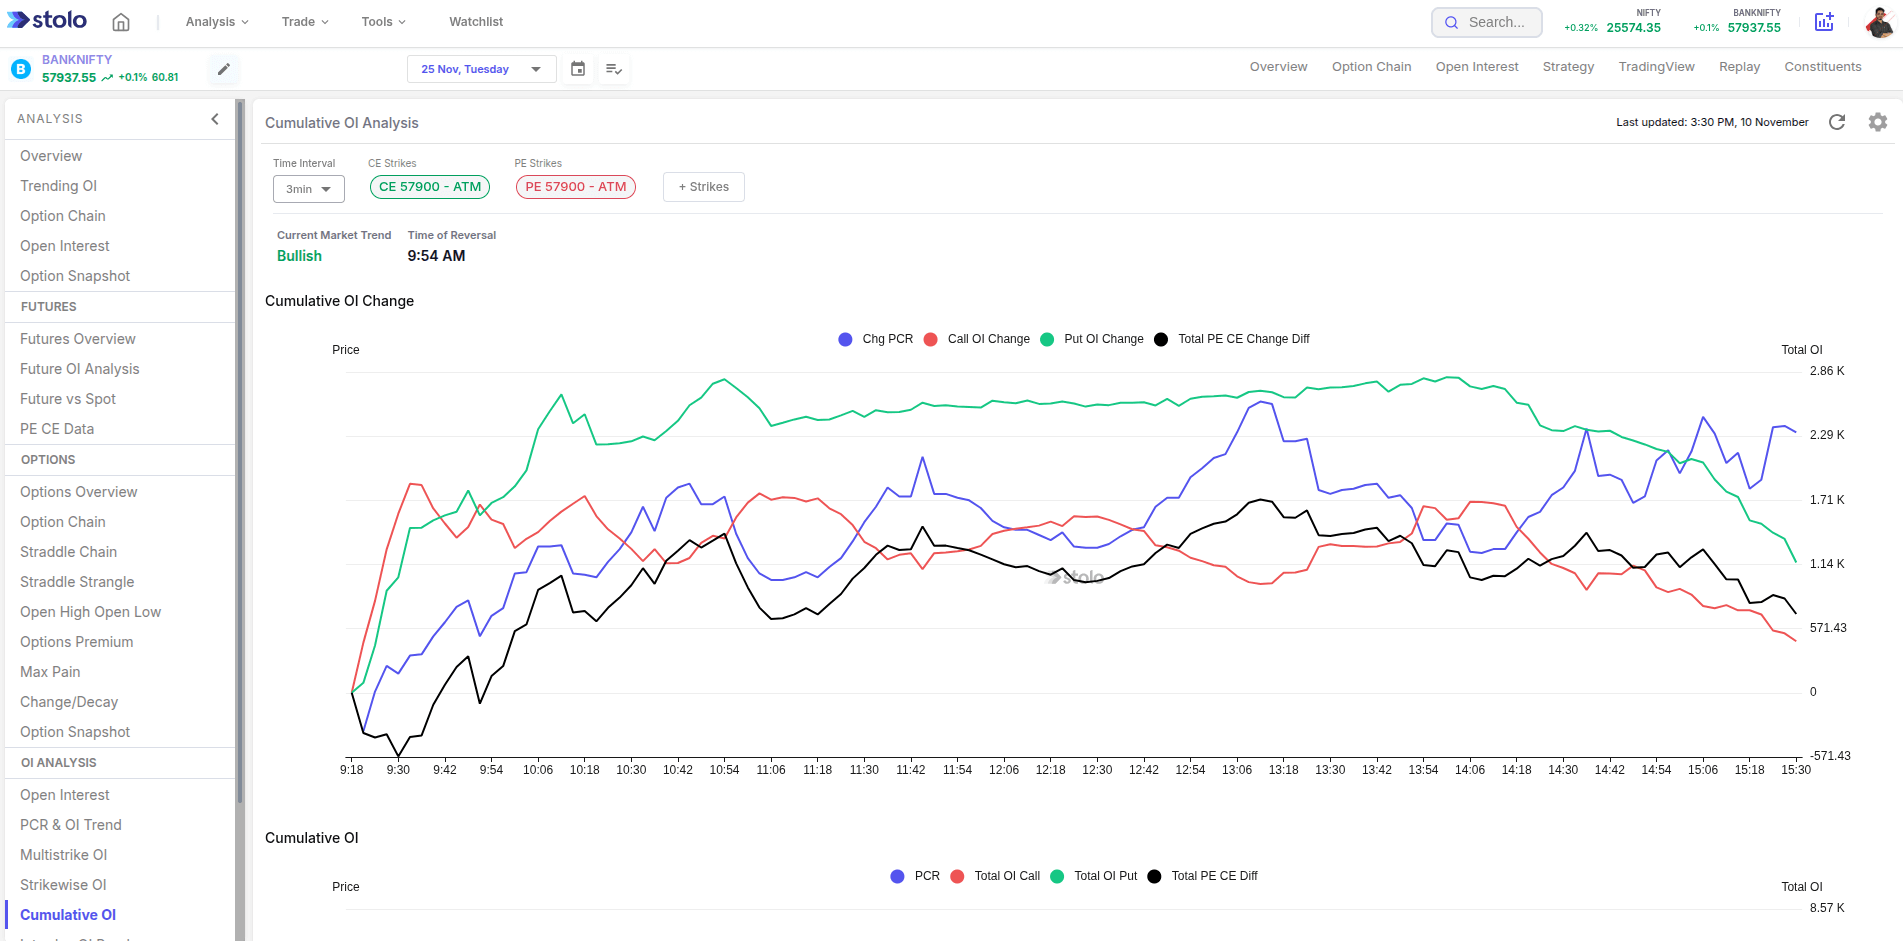
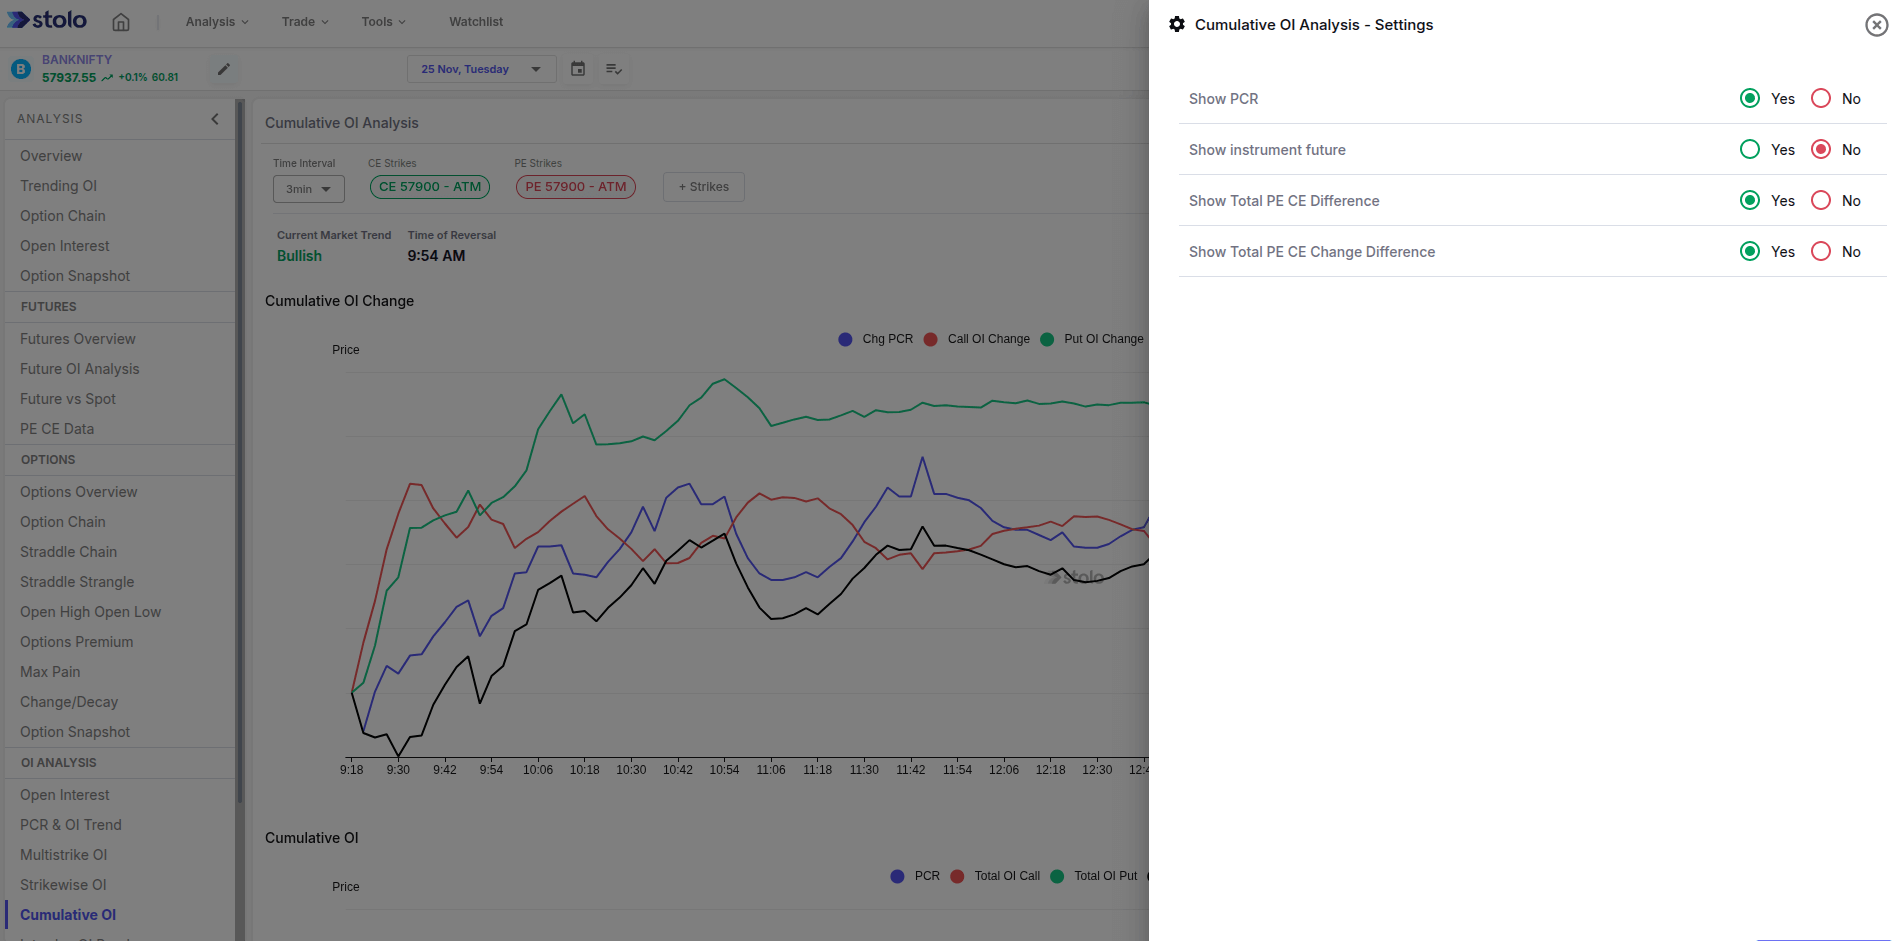
- Open Analysis, then Options, then Cumulative OI Analysis.
- Choose the instrument and the expiry.
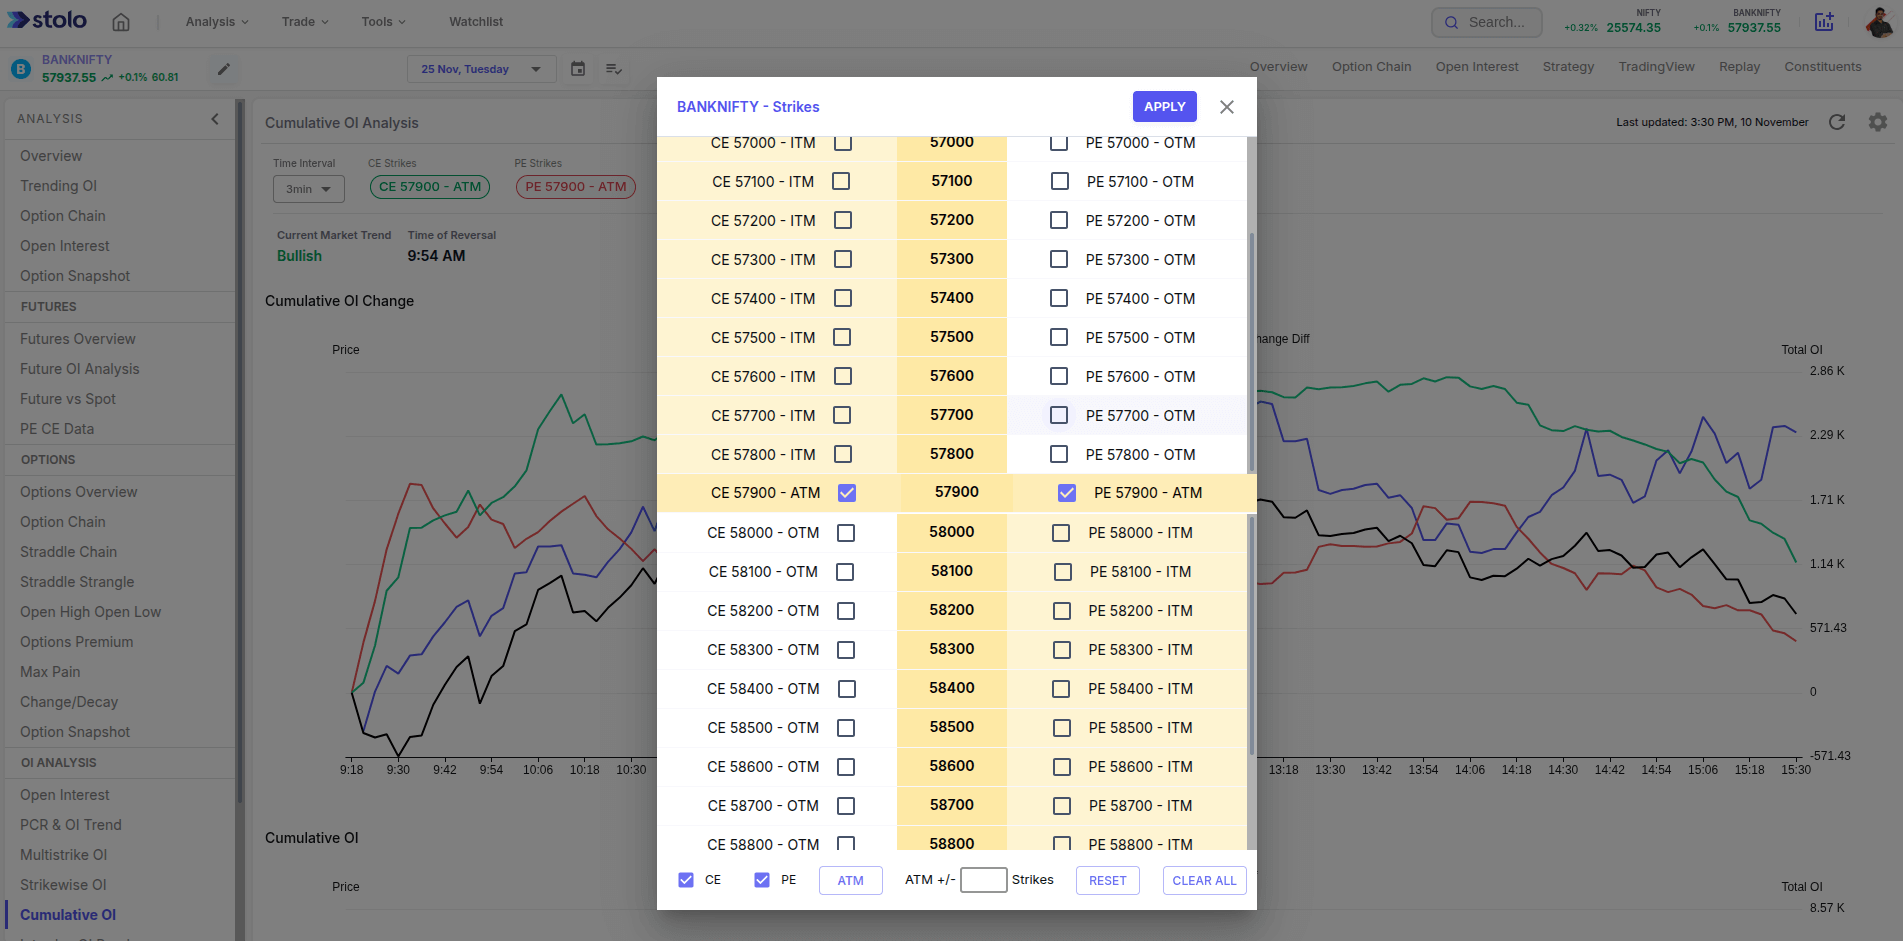
- Set the strike band to include: wide for a market read, narrow for the battleground around price.
- Pick the time interval.
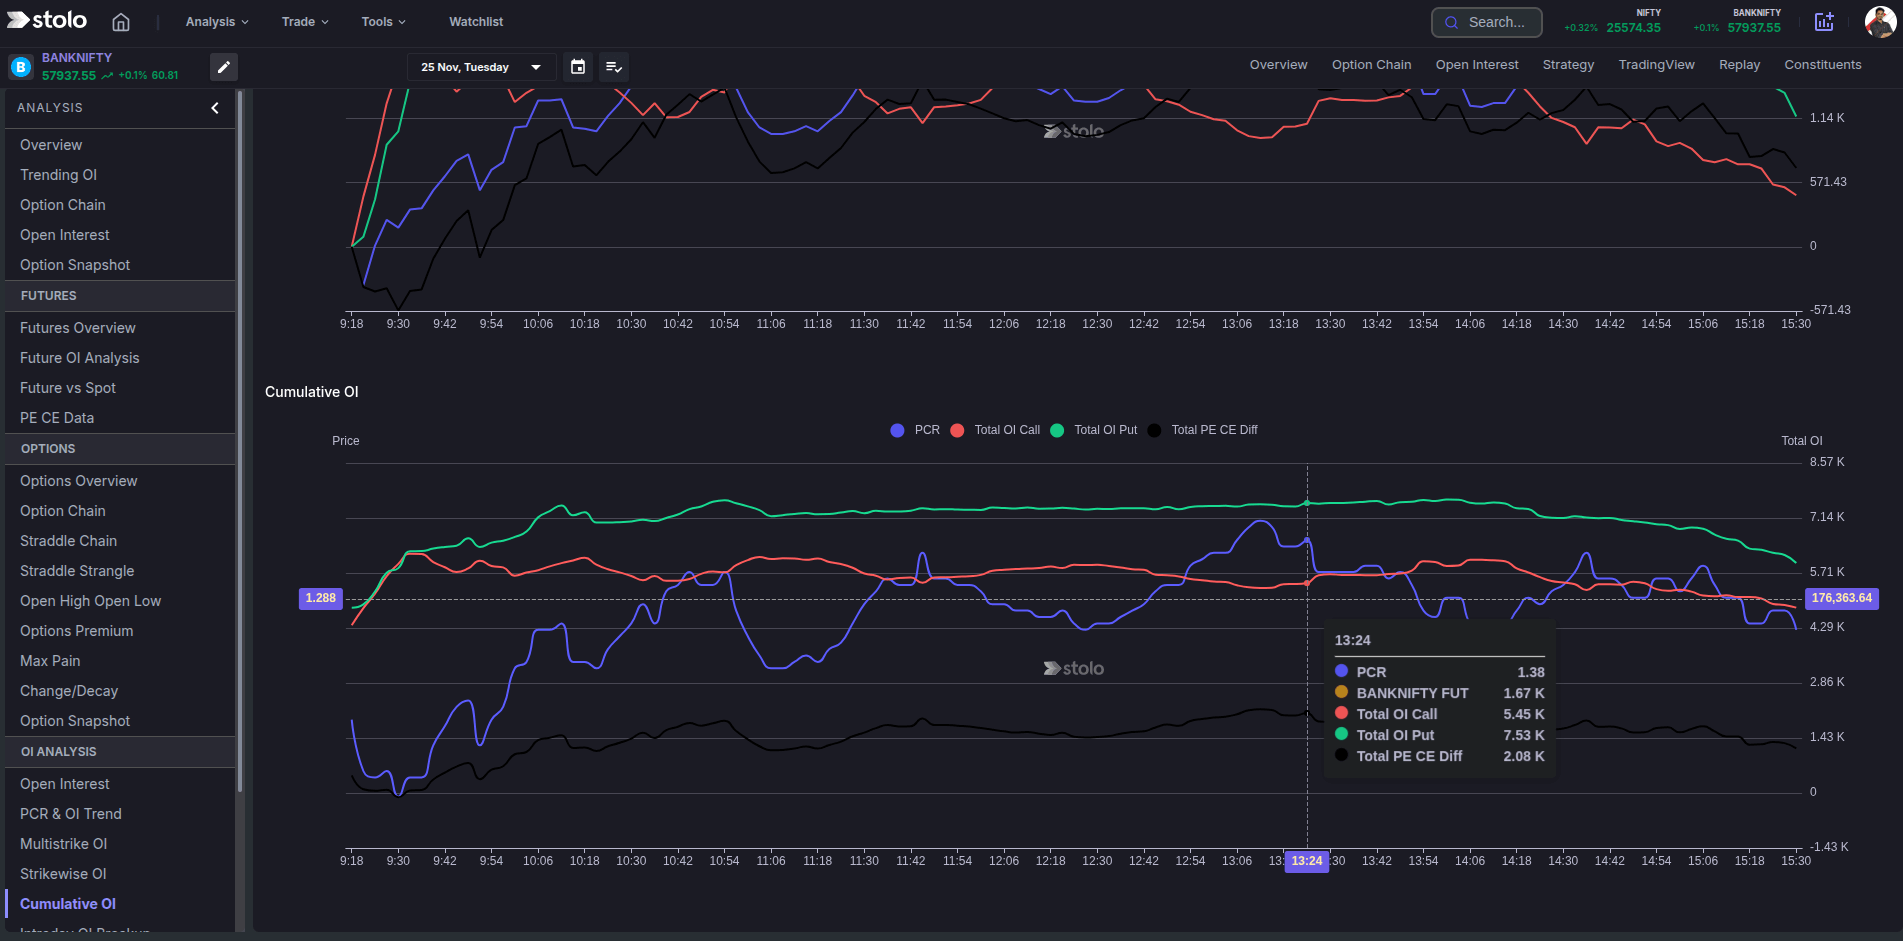
- Read the two OI lines against price, the PCR line, and the trend and reversal marker.
- Switch to a past date to see how net positioning built into a previous session.
Line up the reversal marker with the price chart. A sentiment flip that lands right at a price level you were watching is a stronger signal than either on its own.
How traders use it
- Session bias. The trend read sets whether you are looking for longs or shorts today.
- Rally and selloff attribution. Which OI line drove the move tells you whether it was put writers pushing up or call writers pushing down.
- Reversal timing. The flip in cumulative OI often leads the price turn by a few minutes.
- PCR extremes. A cumulative PCR far from its usual range for the instrument is a contrarian flag.
Live mode and history mode
Live mode streams the cumulative lines through the session. History mode redraws them for a date you choose, which is how you learn what net positioning looked like before a past expiry or a policy day.
Frequently asked questions
What is cumulative OI analysis?
How is cumulative OI different from strikewise OI?
What does it mean when cumulative call OI rises faster than put OI?
What is the trend and reversal marker on the chart?
Which strikes are included in the cumulative total?
Can I change the time interval?
Does cumulative OI analysis work on stocks?
Can I see cumulative OI for a past session?
How should I use cumulative OI with price?
Which plan includes cumulative OI analysis?
Read the option market's net lean in one chart
Open Stolo's Cumulative OI Analysis for total call and put OI, PCR and the intraday trend on any F&O instrument.
Start with a Flexi Trial from ₹199