Straddle and Strangle Chart: Read the Expected Move
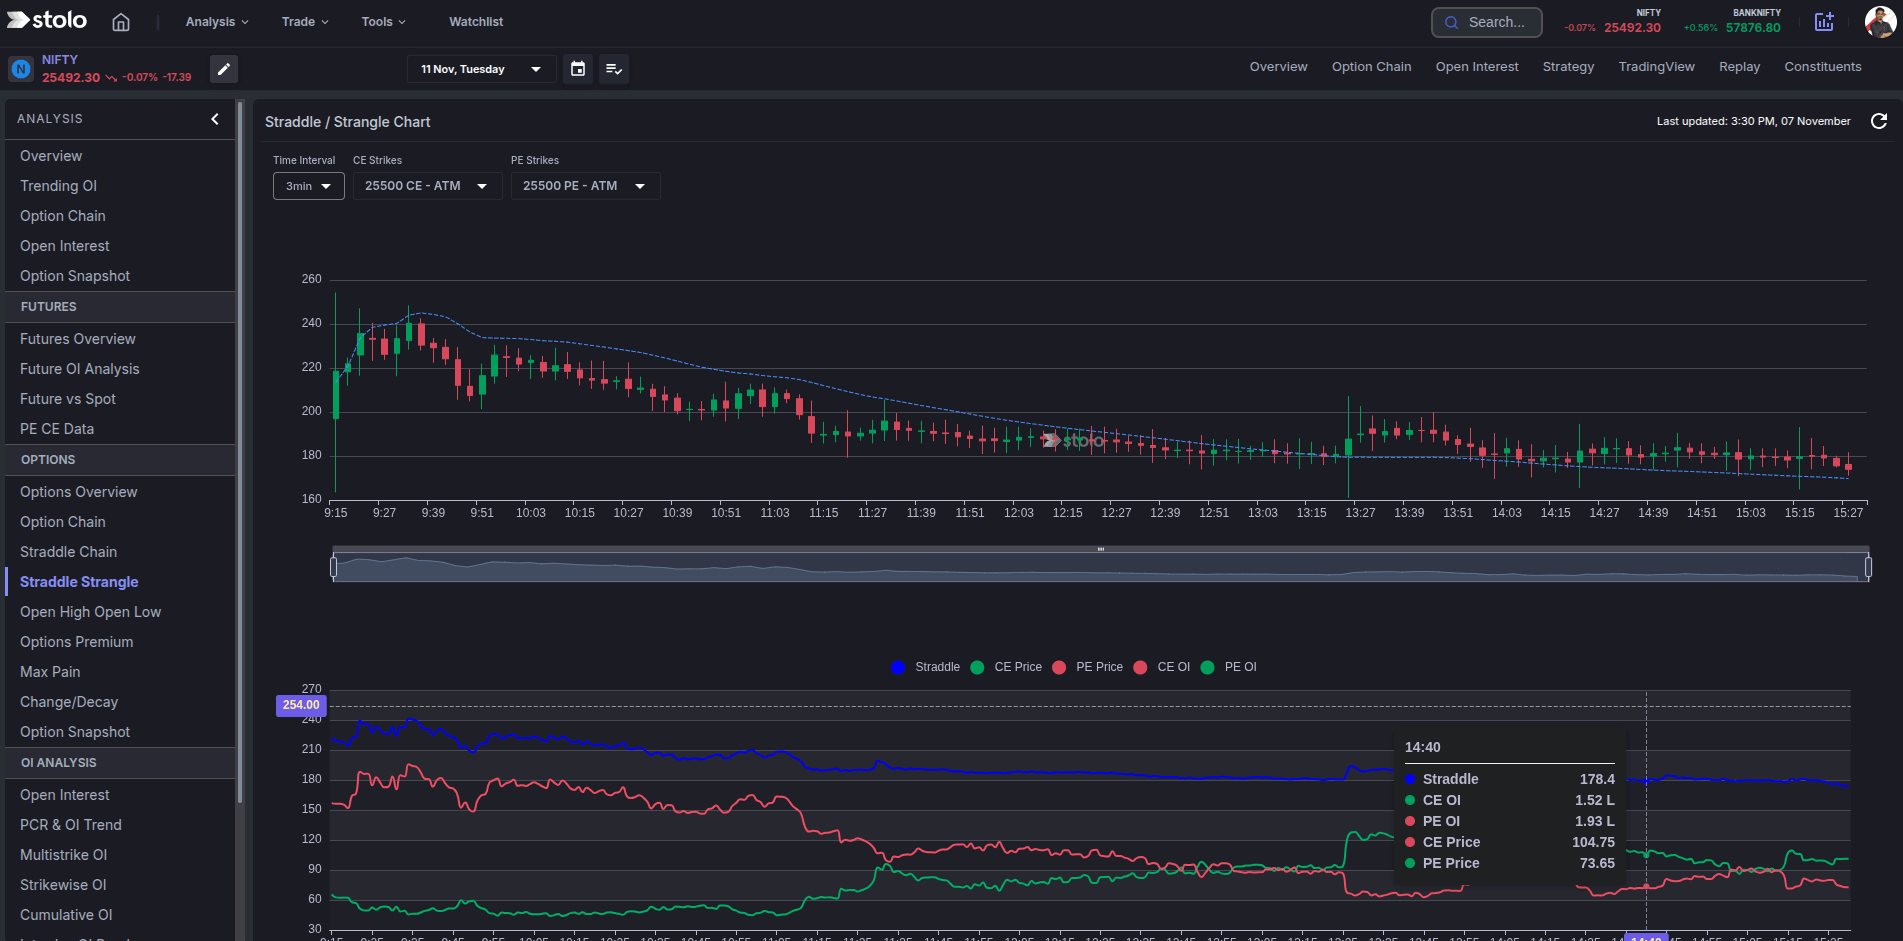
The combined premium of an at-the-money call and put is the market's single best estimate of how far an instrument will move by expiry. Stolo's straddle and strangle chart plots that combined premium over the session, so you can watch the expected move expand and contract, read the breakeven band, and see whether volatility is being priced up or down.
Understand how to use Stolo's Straddle and Strangle Chart
The problem it solves
Traders want to know how big a move the market is expecting, and whether options are cheap or expensive relative to that. Working it out means adding call and put premiums by hand and tracking the total through the day. The chart does the arithmetic continuously and shows the expected move as a line, with the breakevens drawn in.
The concept
- The ATM straddle prices the move. Its premium is roughly the one standard deviation move expected by expiry, in points.
- Breakevens frame the trade. Strike plus premium is the upper breakeven, strike minus premium the lower. Price must leave that band for a buyer to profit.
- The premium decays. On a quiet day the straddle falls steadily as the session runs out. On an event day it rises as the market prices in uncertainty.
- A strangle widens the band and cuts the cost. Comparing the two shows the trade-off between range and premium.
Key terms explained
| Term | What it means |
|---|---|
| ATM straddle | The at-the-money call plus put. Its premium is the expected move. |
| Strangle | A call and put at different OTM strikes. Cheaper, wider breakevens. |
| Breakeven | Strike plus or minus the combined premium. |
| Expected move | The market's estimate of the range by expiry, from the straddle premium. |
| Volatility contraction | The straddle premium falling faster than time decay alone. Favours sellers. |
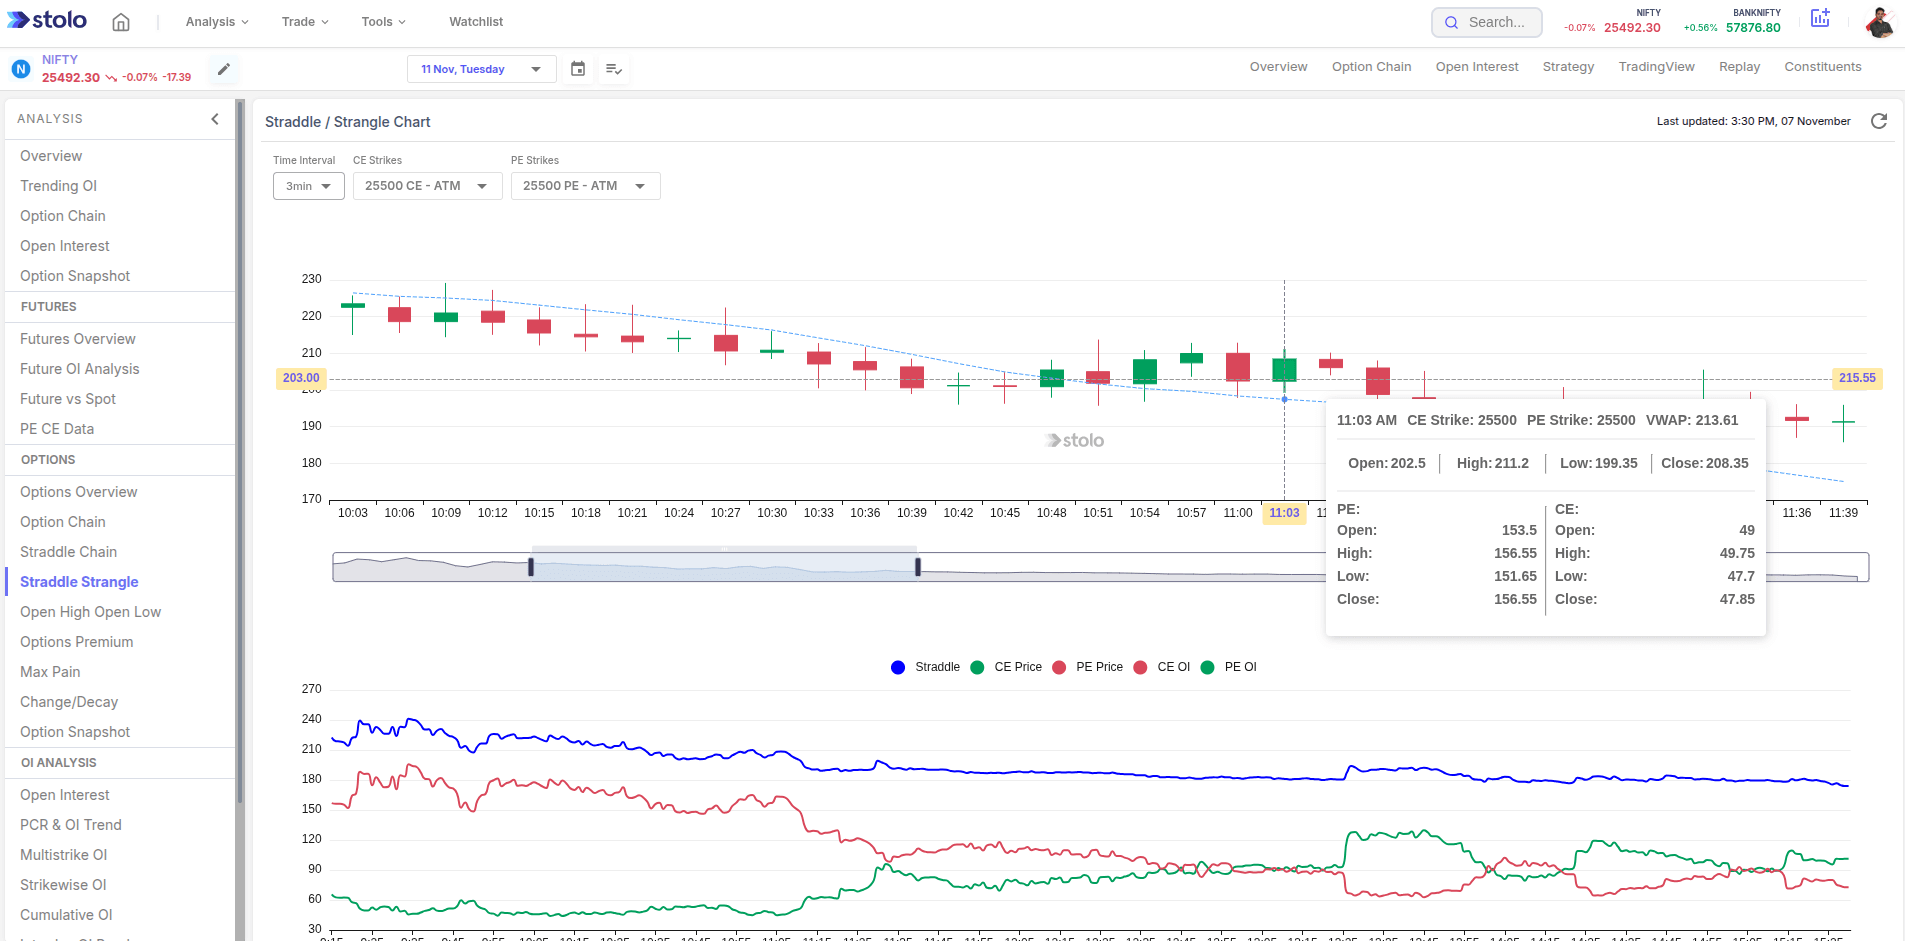
| VWAP | Volume-weighted average price, shown on hover for each bar. |
A worked example
NIFTY is at 22,000. The weekly ATM straddle (22,000 CE plus 22,000 PE) is trading at 140.
- The expected move is about 140 points, so the breakevens are 21,860 and 22,140.
- Through a quiet morning the straddle drifts down to 115 with price near 22,010. That is decay: the day is passing with no move.
- A trader who sold the straddle at 140 is now up 25 points of premium, with price still comfortably inside the band.
If instead the straddle had climbed to 165 by 11:00 with price flat, the market would be pricing in more movement, likely ahead of a scheduled event, and a short straddle would be the wrong side.
How to use it in Stolo

- Open Analysis, then Options, then Straddle / Strangle Chart.
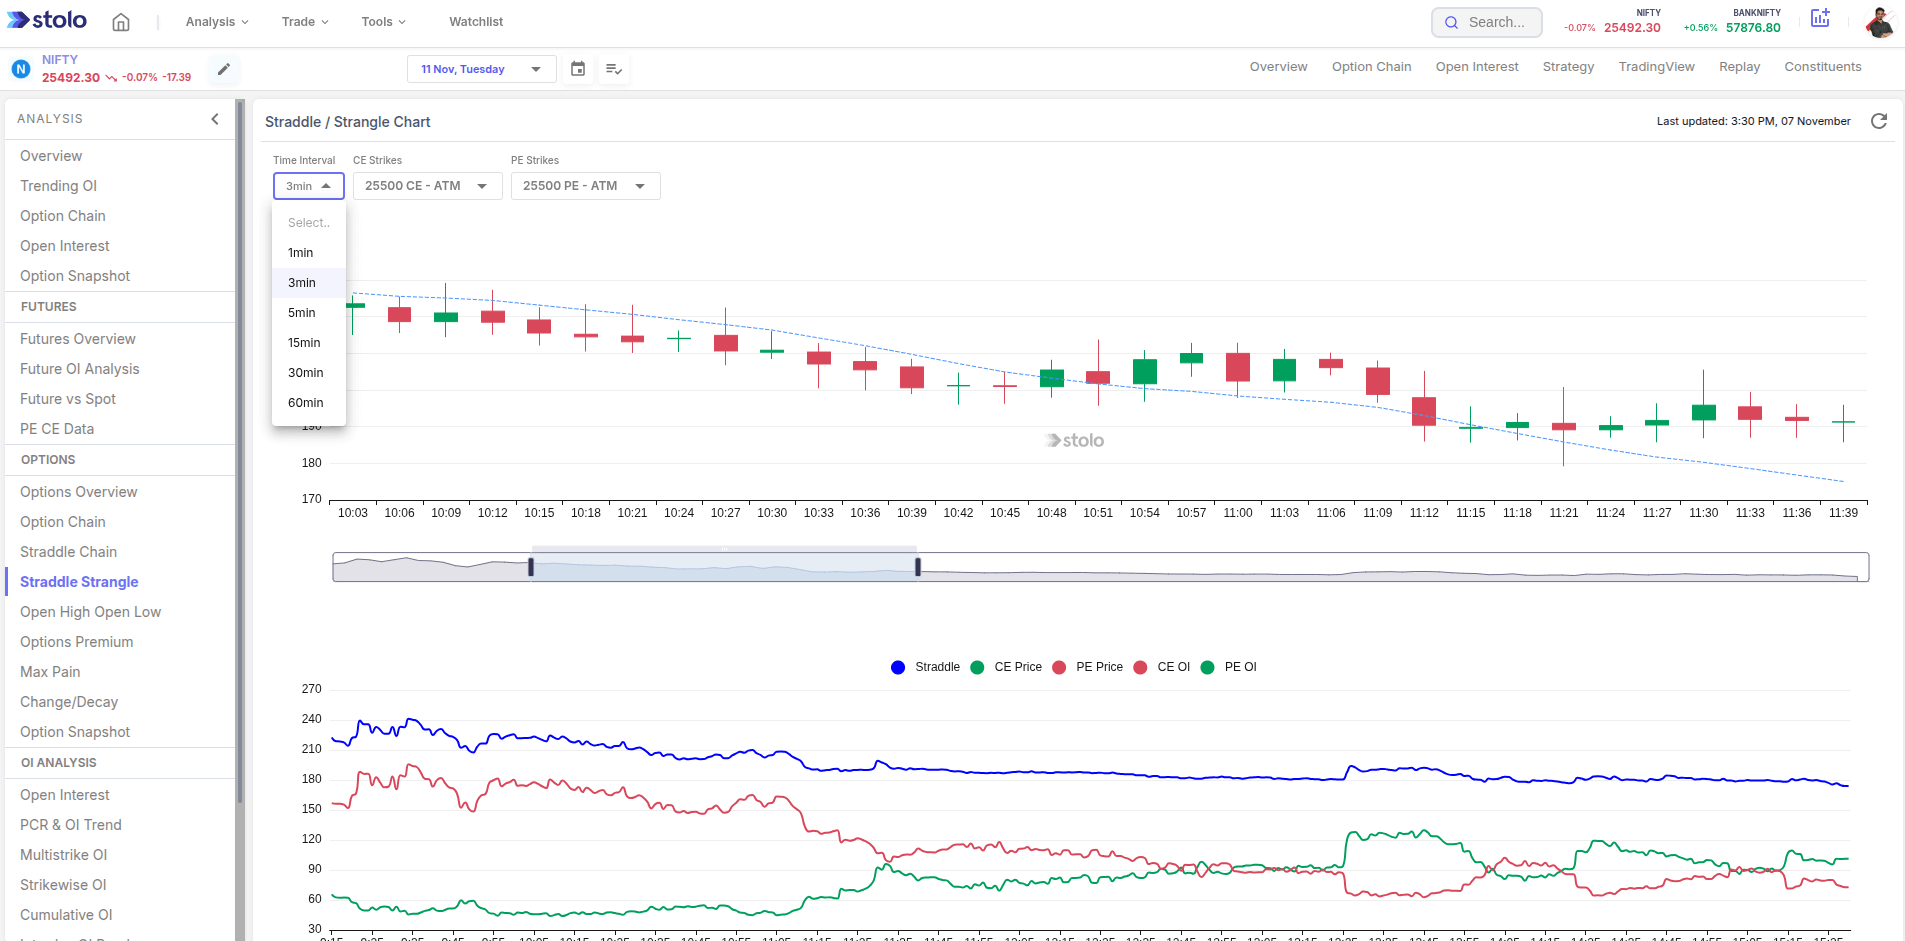
- Choose the instrument and expiry, and the strikes for the straddle or strangle.
- Read the combined premium line: this is the expected move.
- Note the breakeven band and check where price sits inside it.
- Watch the premium trend: falling faster than decay favours sellers, rising favours buyers.
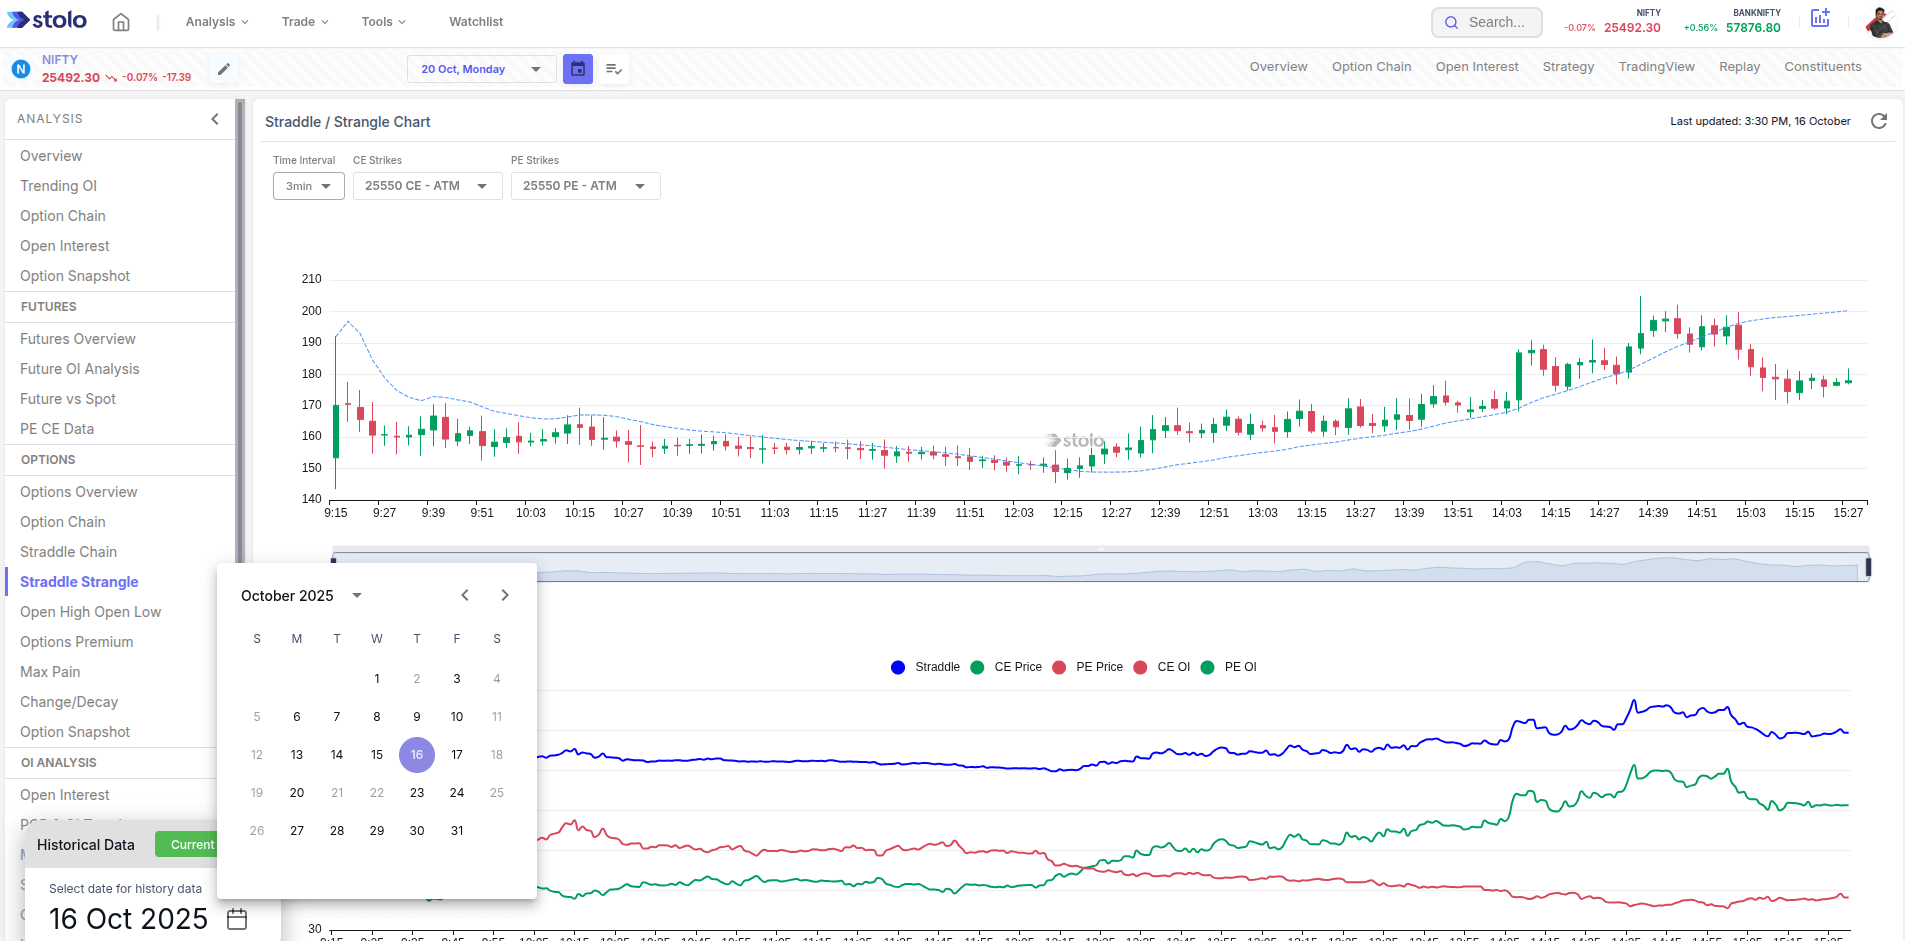
- Hover any bar for OHLC and VWAP, use the time scrubber to zoom, and the calendar icon for a past session.
Stolo does not place trades. Use the chart to judge whether options are cheap or rich versus the likely move, then execute through the option chain or your connected broker.
How traders use it
- Sell into decay. Short the straddle when the premium is high versus the likely range and starting to fall.
- Buy before an event. Go long the straddle when the premium is still low and the market has not yet priced the event.
- Set a range trade. Use the breakeven band as the boundaries for an iron condor or a range scalp.
- Read event pricing. A straddle jumping days before a result tells you how big a move the market expects.
Live mode and history mode
Live mode plots the combined premium through the session. History mode loads a past expiry so you can see how the expected move behaved into a previous settlement or event, which tells you what is normal for the instrument.
Frequently asked questions
What is a straddle and what is a strangle?
What does the ATM straddle premium tell me?
How do I get the breakeven levels from the chart?
What does a falling straddle premium through the day mean?
How is the straddle chart different from the straddle chain?
Can I compare an ATM straddle with an OTM strangle?
Does the straddle chart update live?
Can I view historical straddle data?
How do option sellers use this chart?
Which plan includes the straddle and strangle chart?
See the move the market is pricing in
Open Stolo's Straddle and Strangle Chart to track the expected move and breakeven band for any F&O instrument.
Start with a Flexi Trial from ₹199