PCR OI Trend Chart for NIFTY and F&O Options
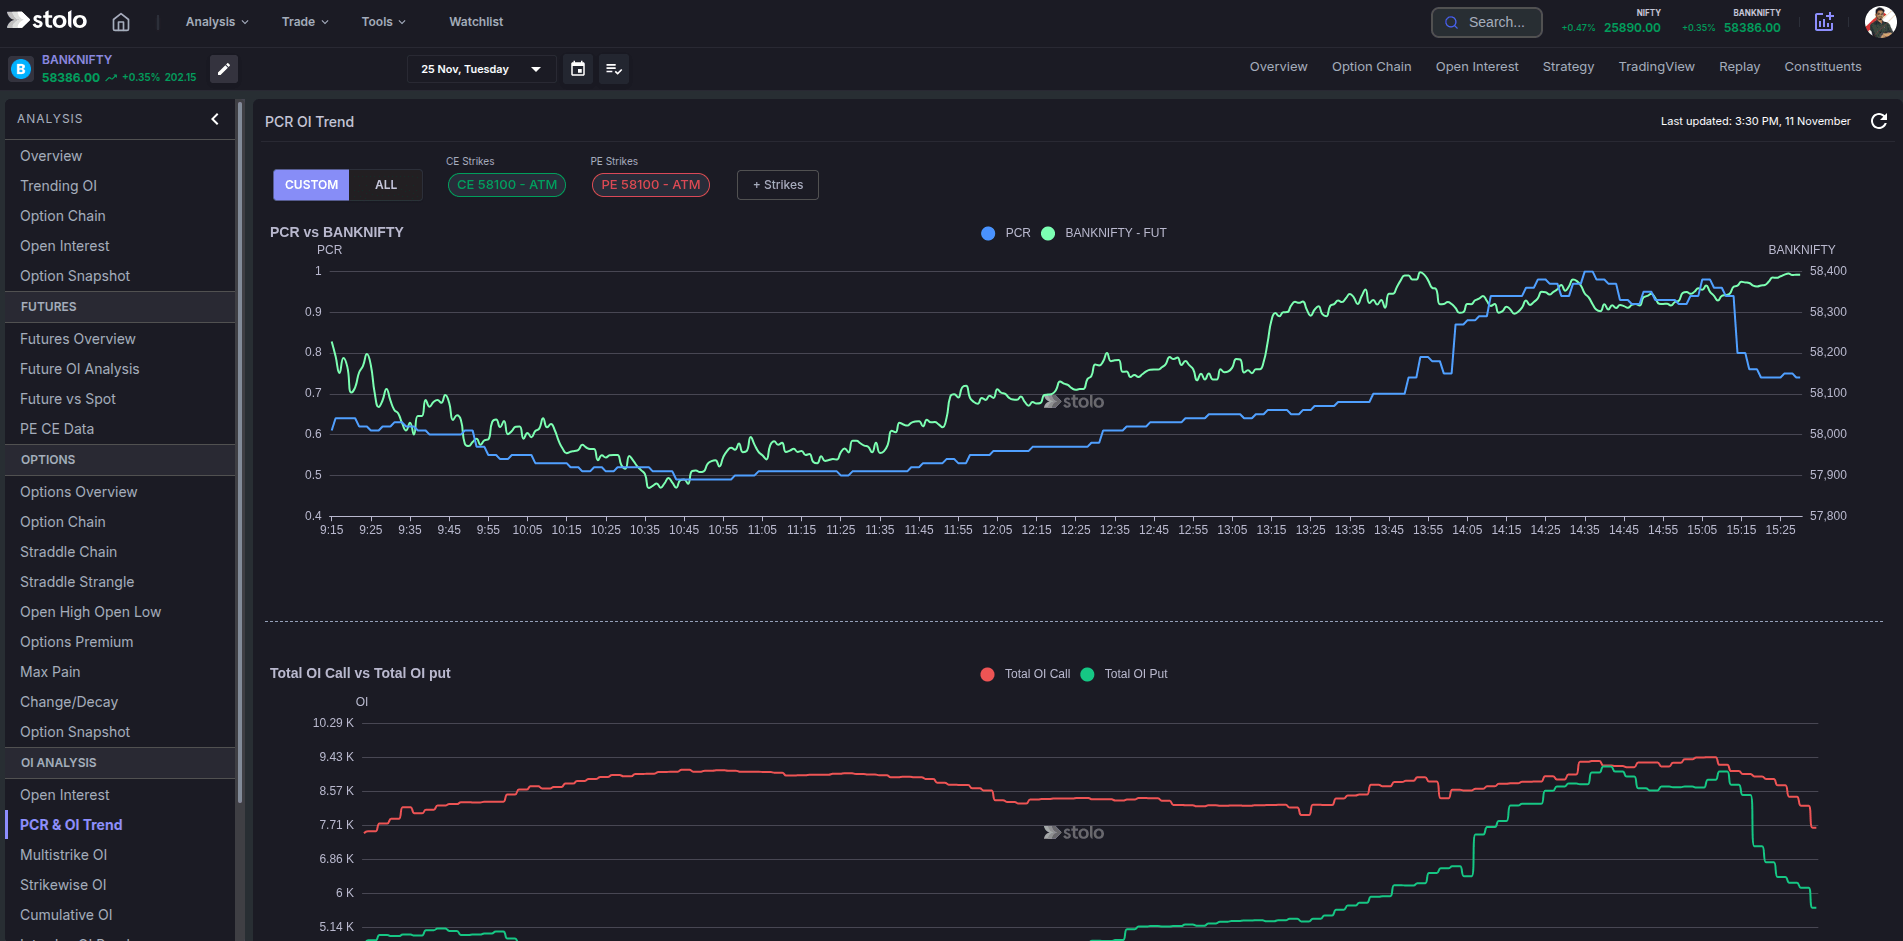
The put-call ratio is the market's quickest sentiment gauge: total put open interest divided by total call open interest. Stolo's PCR OI trend chart plots that ratio as a line through the session against price, so you see not just what sentiment is but which way it is moving and whether it agrees with what price is doing.
PCR OI Trend in Stolo
The problem it solves
A single PCR number, the one your broker shows, is almost useless without context. Is 1.2 high or low for this instrument today? Has it been rising or falling? Is price confirming it? The trend chart answers all three by showing the path of PCR against price, which is where the actual signal lives.
The concept
- PCR measures which side is writing. Put writers sell puts when they expect support to hold. Call writers sell calls when they expect resistance to hold. PCR is the balance between them.
- Direction matters more than level. Rising PCR means put writing is winning, which supports price. Falling PCR means call writing is winning, which caps it.
- Confirmation. When price and PCR trend the same way, the move has options positioning behind it.
- Divergence. When they split, the writers are fading the price move, and a turn is more likely.
Key terms explained
| Term | What it means |
|---|---|
| PCR | Put open interest divided by call open interest across the chain. |
| Put writing | Selling puts, a bullish to neutral stance. Pushes PCR up. |
| Call writing | Selling calls, a bearish to neutral stance. Pushes PCR down. |
| PCR trend | The direction of the PCR line through the session. |
| Divergence | Price and PCR moving opposite to the expected relationship. |
| Total OI panel | The companion view showing raw put and call OI, so you see which leg is moving. |
A worked example
NIFTY opens at 22,000. The PCR OI trend chart shows PCR at 1.05.
- Through the morning NIFTY rises to 22,120 and PCR climbs to 1.35. Price and PCR agree: put writers are driving the move. A long is well supported.
- After 13:00 NIFTY pushes to 22,160 but PCR rolls over to 1.20 and keeps falling. This is a divergence: call writers are now selling into the rally.
- By 14:30 NIFTY is back at 22,090 and PCR is at 1.05.
A trader watching the chart books the long near 22,150 when the divergence appears, rather than giving back the whole move into the close.
How to use it in Stolo
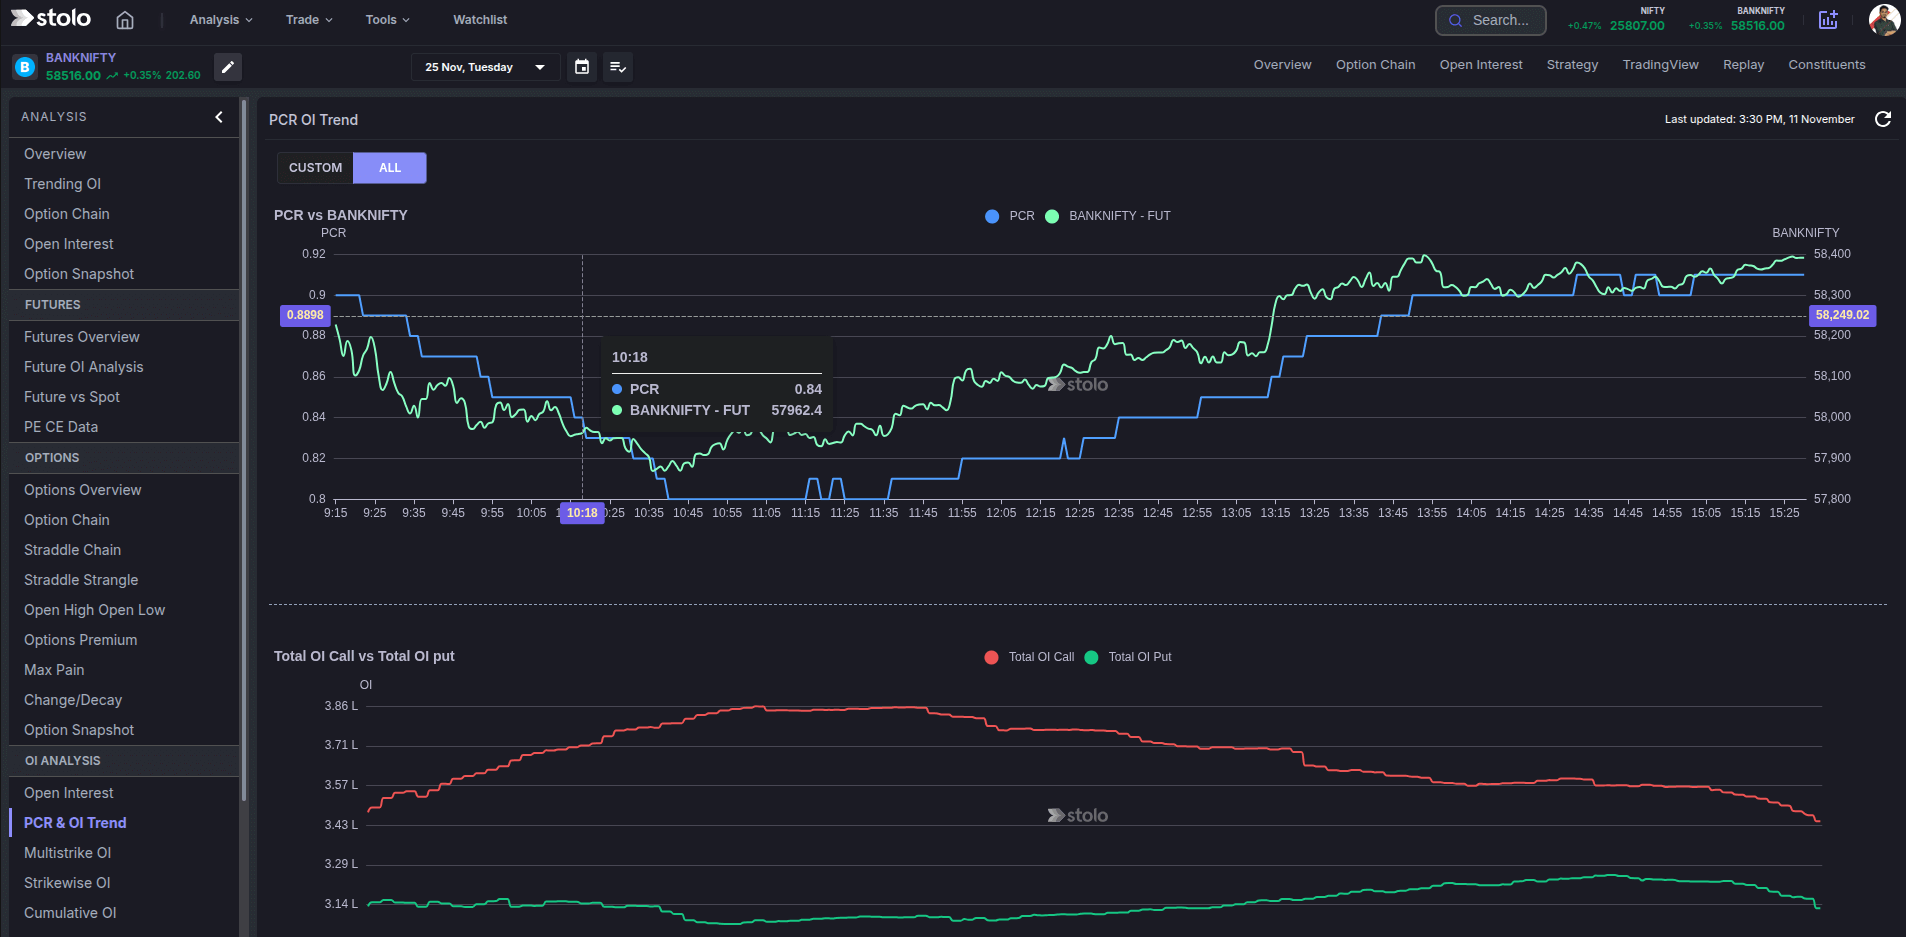
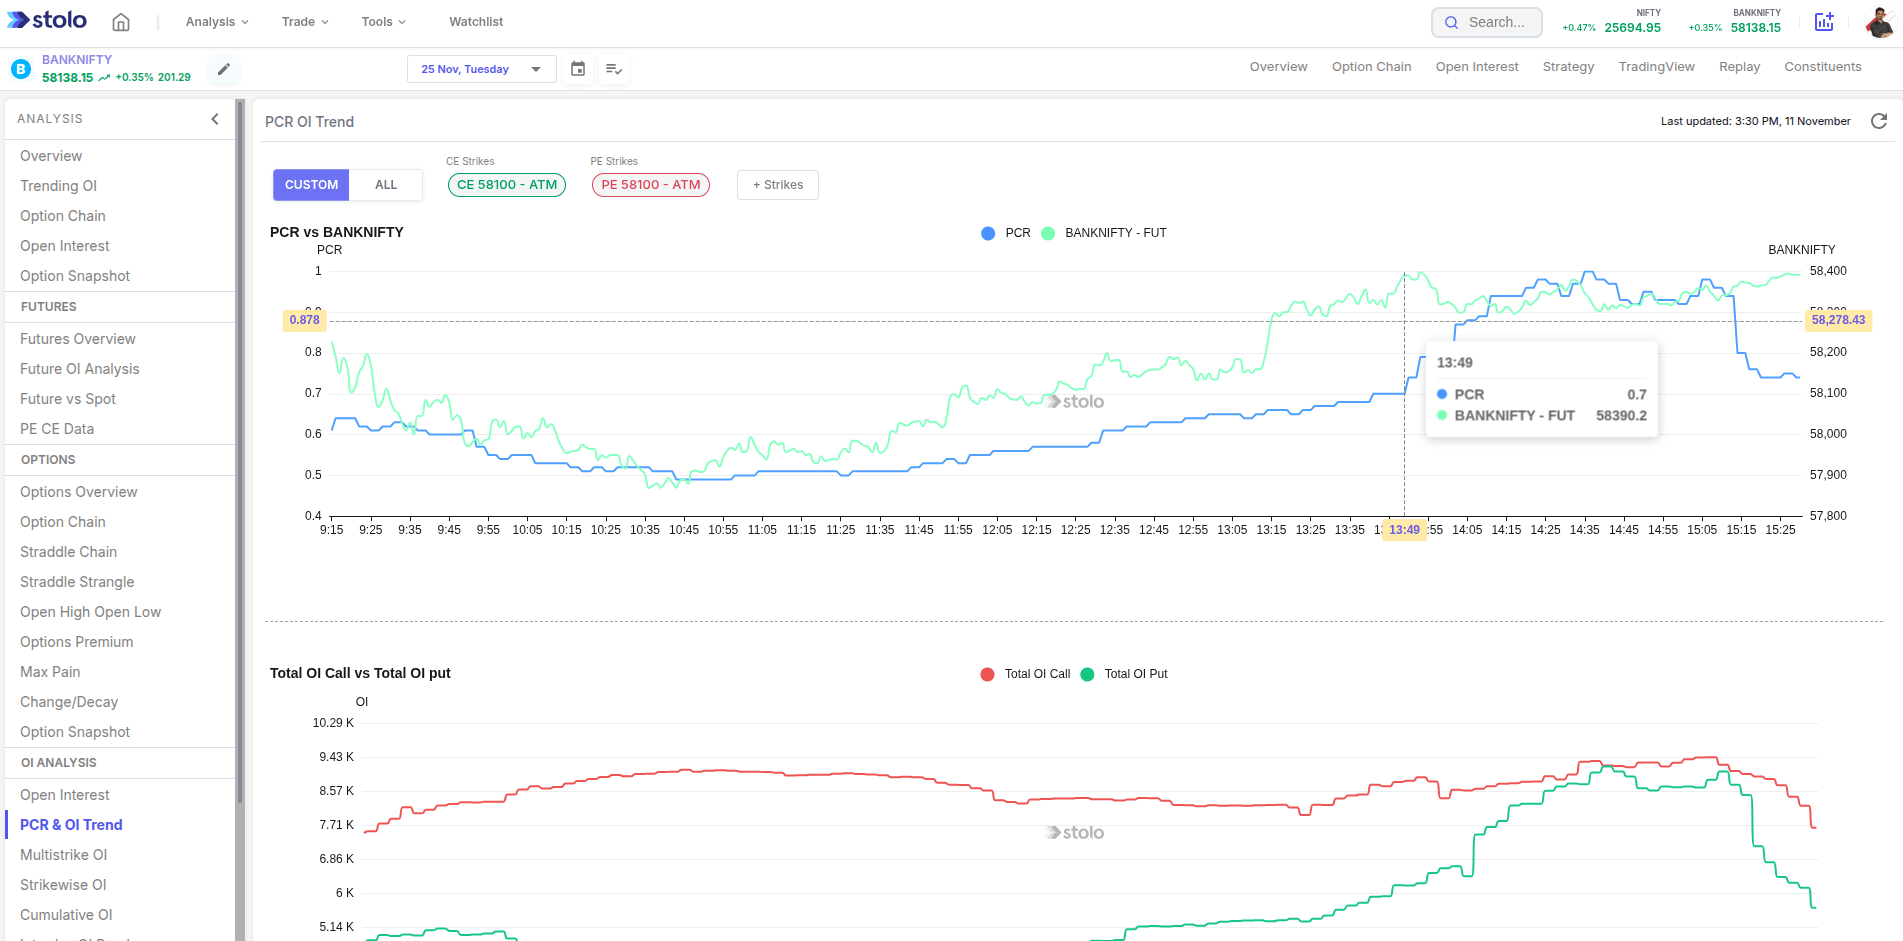
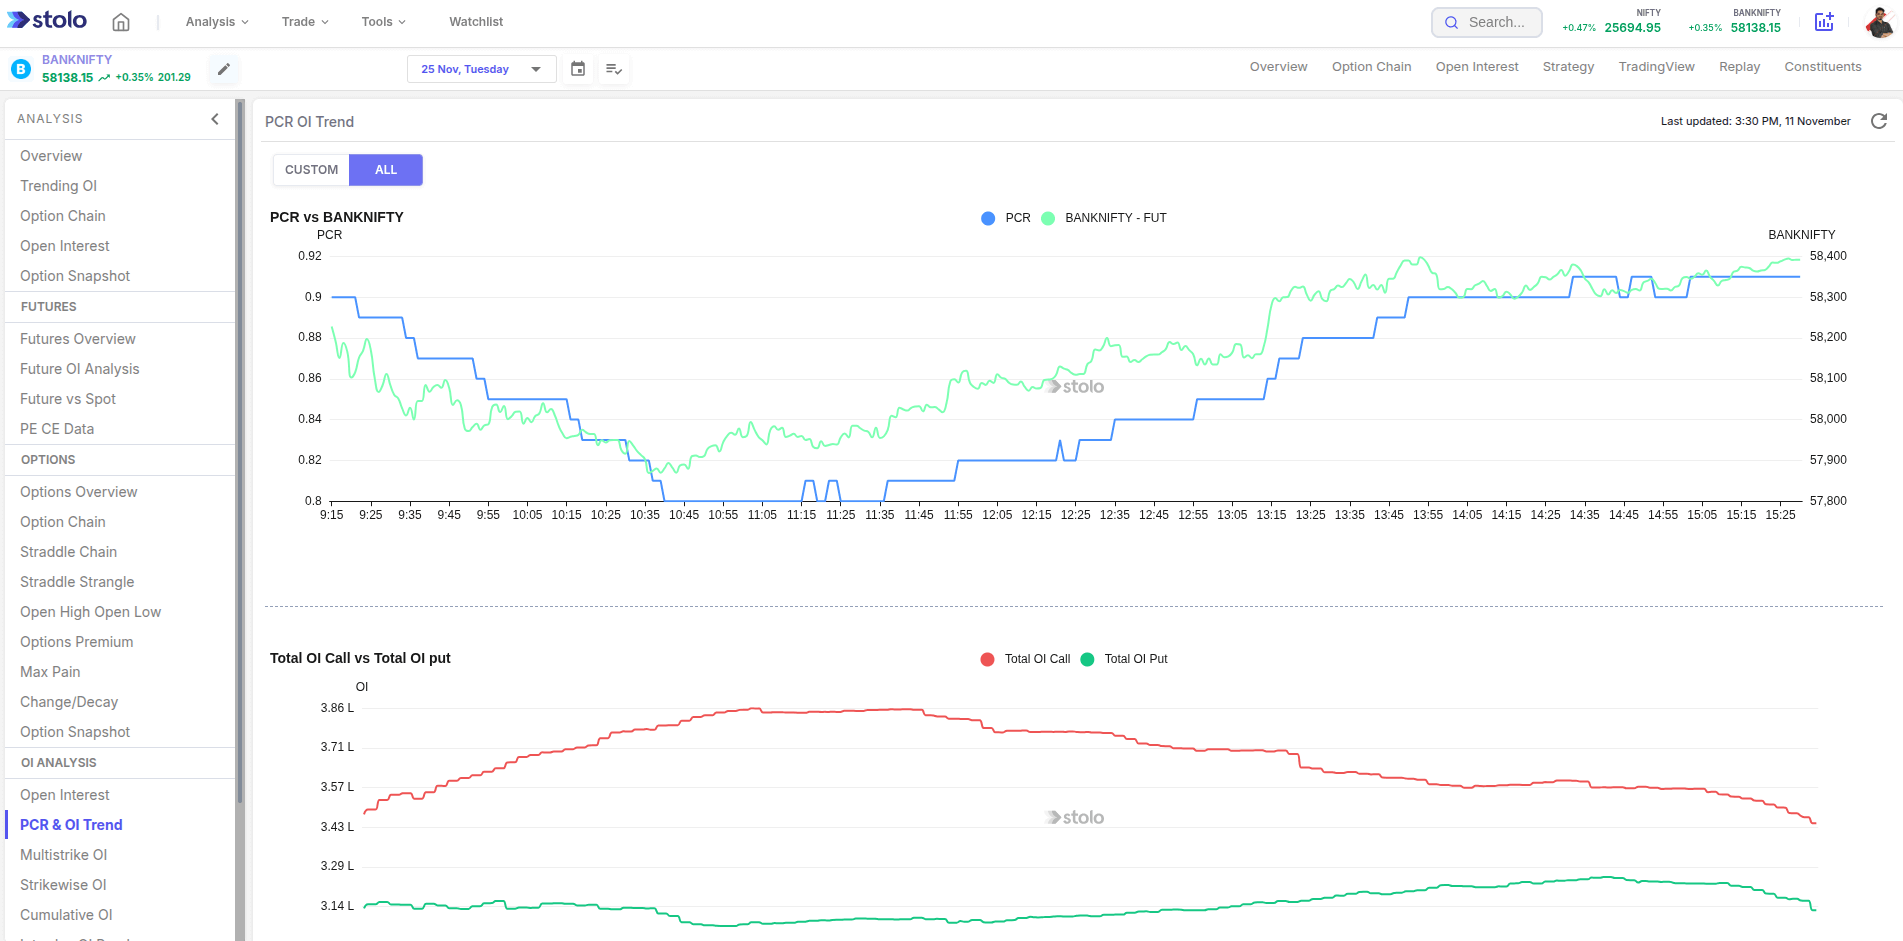
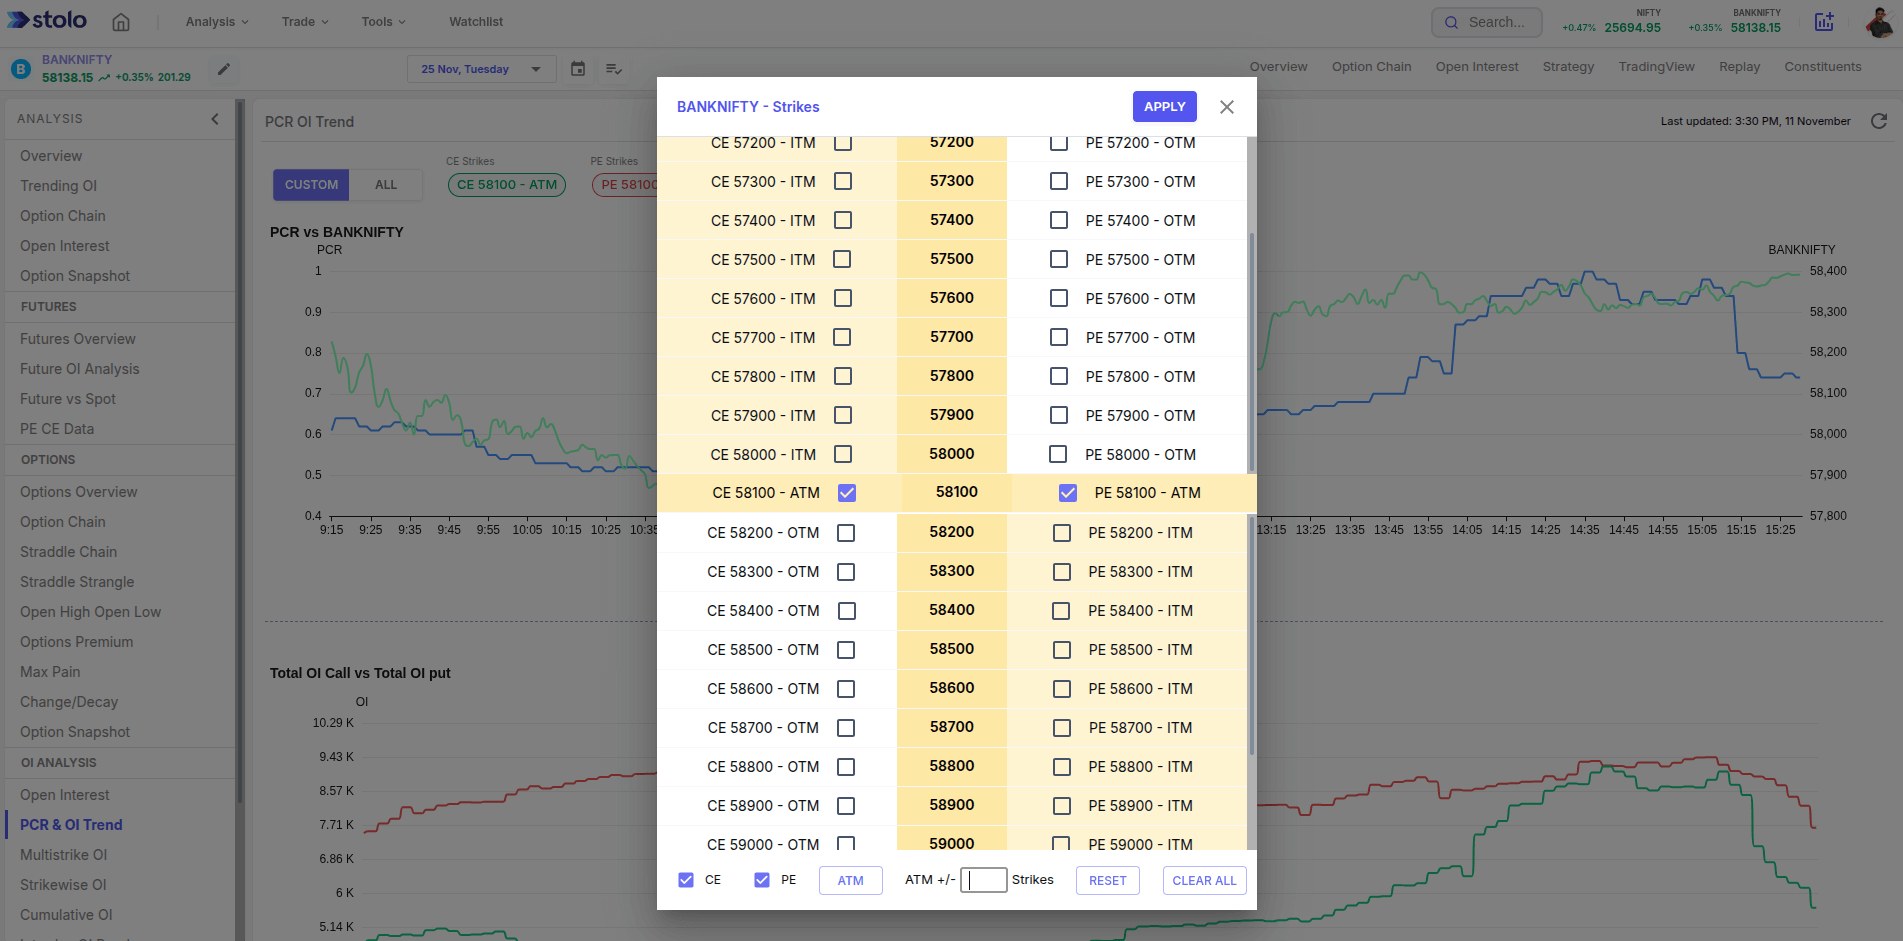
- Open Analysis, then Options, then PCR OI Trend.
- Choose the instrument and expiry.
- Read the PCR line against price: same direction is confirmation, opposite is divergence.
- Check the total call and put OI panel to see which leg is moving the ratio.
- Note where PCR sits relative to its own range over the last few sessions.
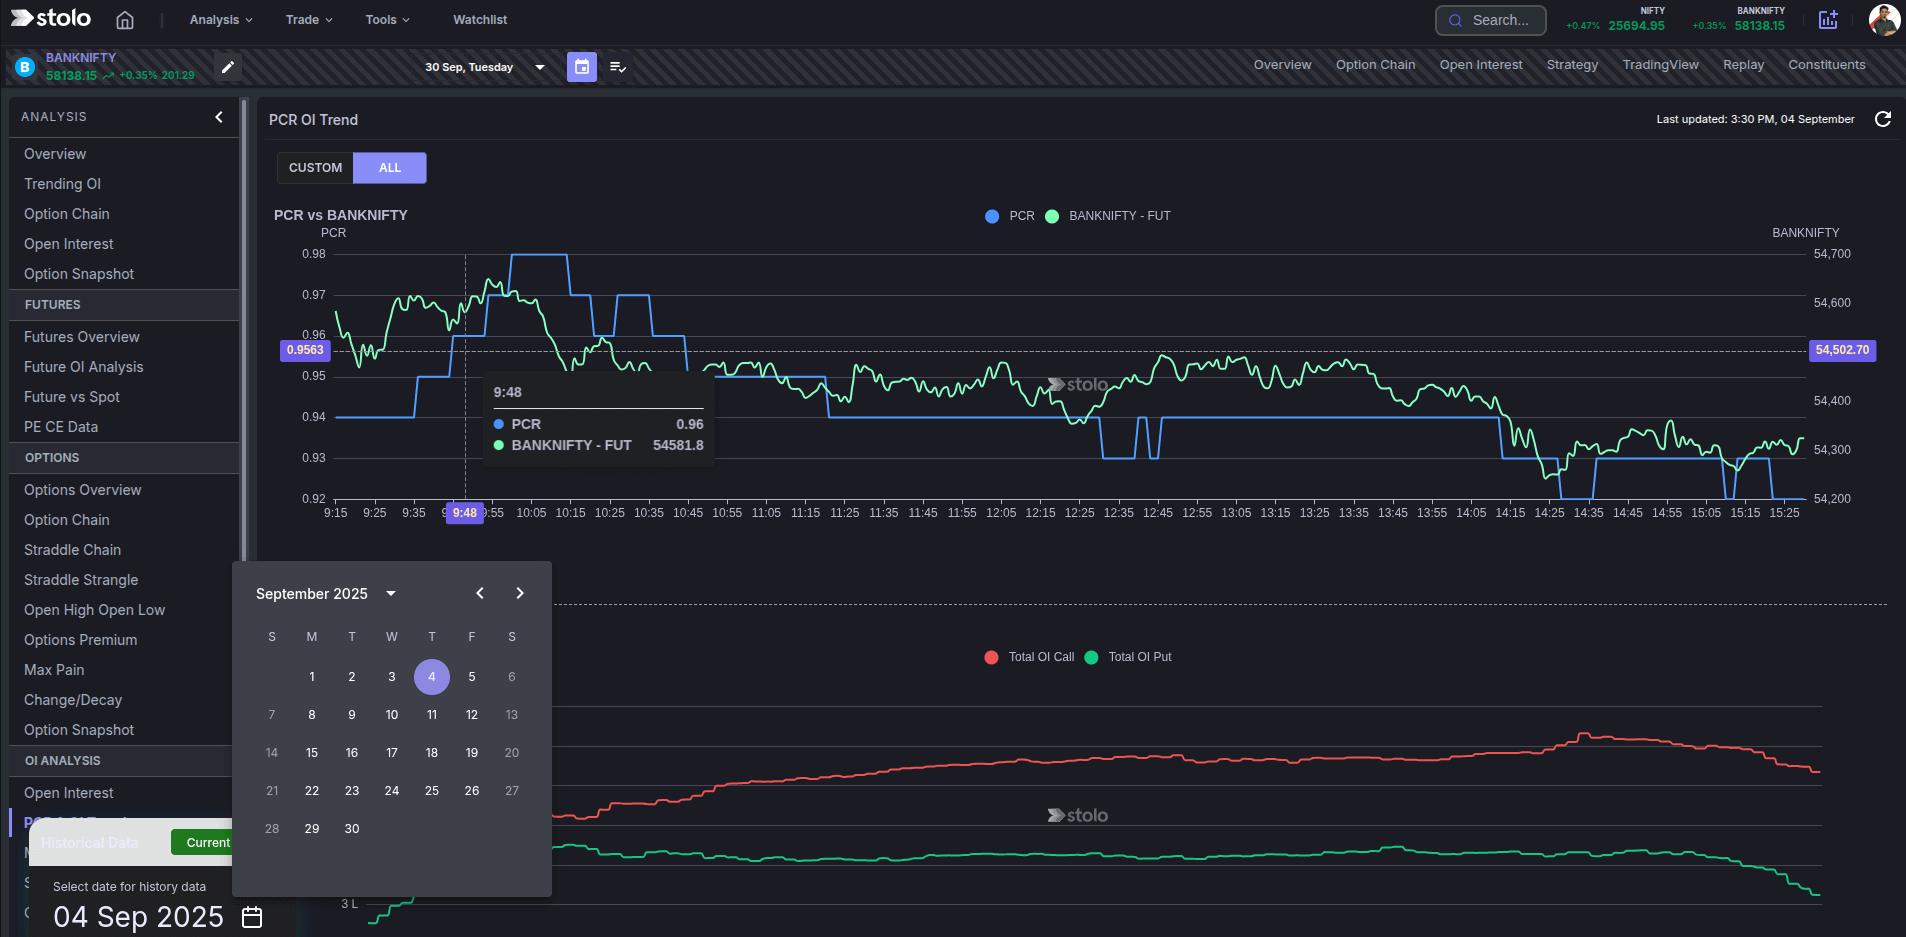
- Load a past date to study PCR behaviour around a previous event.
PCR is most reliable on the index. On a single stock the option chain can be thin enough that one large trade swings the ratio, so weight it less there.
How traders use it
- Trend confirmation. Only hold a directional index trade while PCR agrees with it.
- Exit timing. A PCR divergence against your position is a reason to tighten the stop or book.
- Contrarian extremes. PCR far above its normal band into a multi-day rally is a complacency warning.
- Expiry read. PCR flattening near 1 into expiry afternoon supports a pinning outcome.
Live mode and history mode
Live mode streams the PCR path through the day. History mode redraws it for a date you choose, so you can learn how sentiment moved around a past budget, policy or expiry and recognise the shape next time.
Frequently asked questions
What is the put-call ratio?
What does the PCR OI trend chart show?
Is a high PCR bullish or bearish?
What PCR level is considered normal for NIFTY?
How is this different from the PCR number on the option chain?
Does the PCR chart update live?
Can I view the PCR trend for a past day?
Should I trade on PCR alone?
What is a PCR divergence?
Which plan includes the PCR OI trend chart?
Track option sentiment as it turns
Open Stolo's PCR OI Trend chart to plot the put-call ratio against price for any F&O instrument, live or on any past date.
Start with a Flexi Trial from ₹199