Open Interest in Options Trading, Explained
Traders watch price and volume every day. Open interest is the third number, and it is the one that shows what is building beneath the surface: how many option contracts are actually open at each strike, and which way that positioning is shifting. Stolo turns raw OI into a colour-coded, real-time picture for any F&O instrument so you can see where writers are defending and where the crowd is piling in.
Open Interest Analysis in Stolo
The problem it solves
On a broker option chain you see OI numbers changing but cannot tell the story. Are traders building fresh shorts at 22,100, or covering old ones? Is the put wall at 22,000 growing or melting? Reading that by hand across dozens of strikes, while price moves, is not realistic. Stolo computes the buildup type for every strike and every interval and shows it as a chart you can read in a second.
The concept
- One contract, one buyer, one seller. Open interest counts the open pairs. It rises when a new buyer and a new seller create a contract, and falls when both sides close.
- The buildup depends on price. OI moving up tells you positions are being added; whether that is bullish or bearish depends on which way price and premium moved with it.
- Writers defend their strikes. Large, growing OI at a strike means the writers there have an incentive to keep price on their side of it, which is why heavy OI acts as support or resistance.
- Change beats level. The absolute OI shows history. The change in OI over the last few minutes shows what is happening now.
Key terms explained
| Term | What it means |
|---|---|
| Open interest (OI) | Total open contracts at a strike. |
| Change in OI | The move in OI over a chosen interval. The main signal. |
| Long buildup | Price up, OI up. New longs. Bullish. |
| Short buildup | Price down, OI up. New shorts. Bearish. |
| Long unwinding | Price down, OI down. Longs exiting. Weak bearish. |
| Short covering | Price up, OI down. Shorts buying back. Weak bullish. |
| Call wall / put wall | The strike with the largest call or put OI, often resistance or support. |
| PCR (OI) | Put OI divided by call OI across the chain. |
What Stolo's open interest view shows
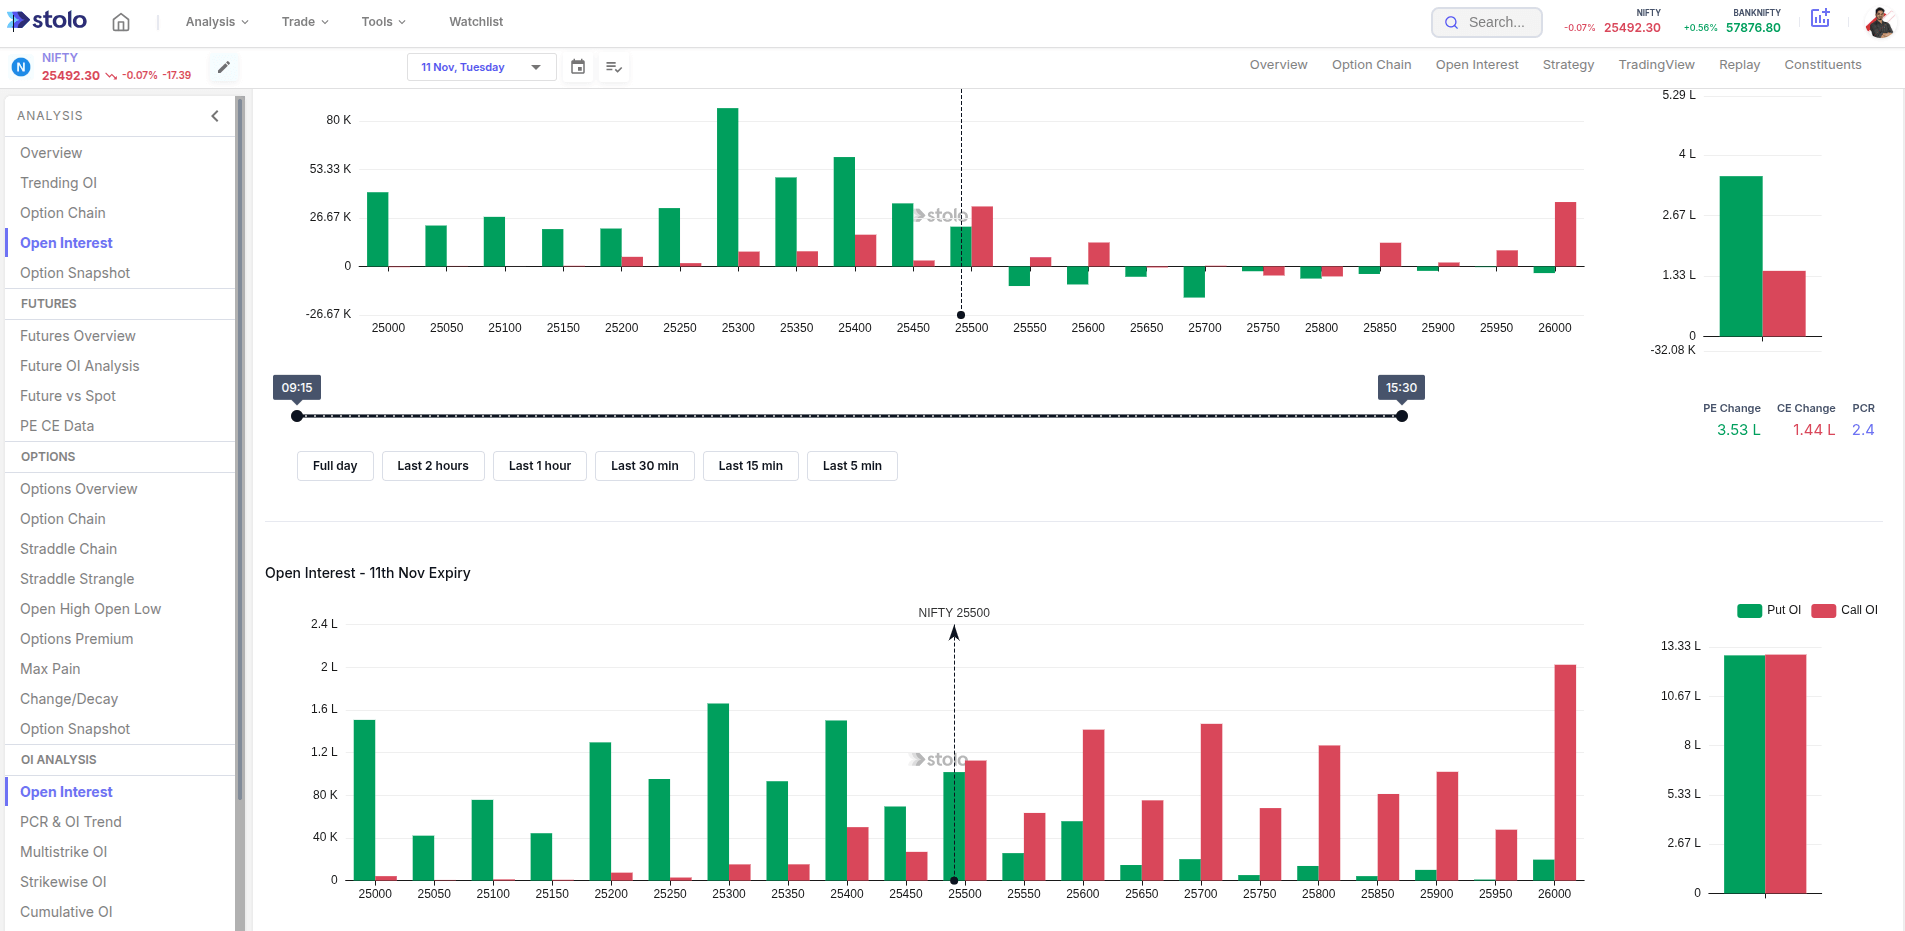
- OI and change in OI by strike, as a chart, for calls and puts with distinct colours.
- Buildup labels on each strike: long buildup, short buildup, long unwinding, short covering.
- A time-interval slider for one to sixty-minute change buckets.
- Overall PCR plotted alongside.
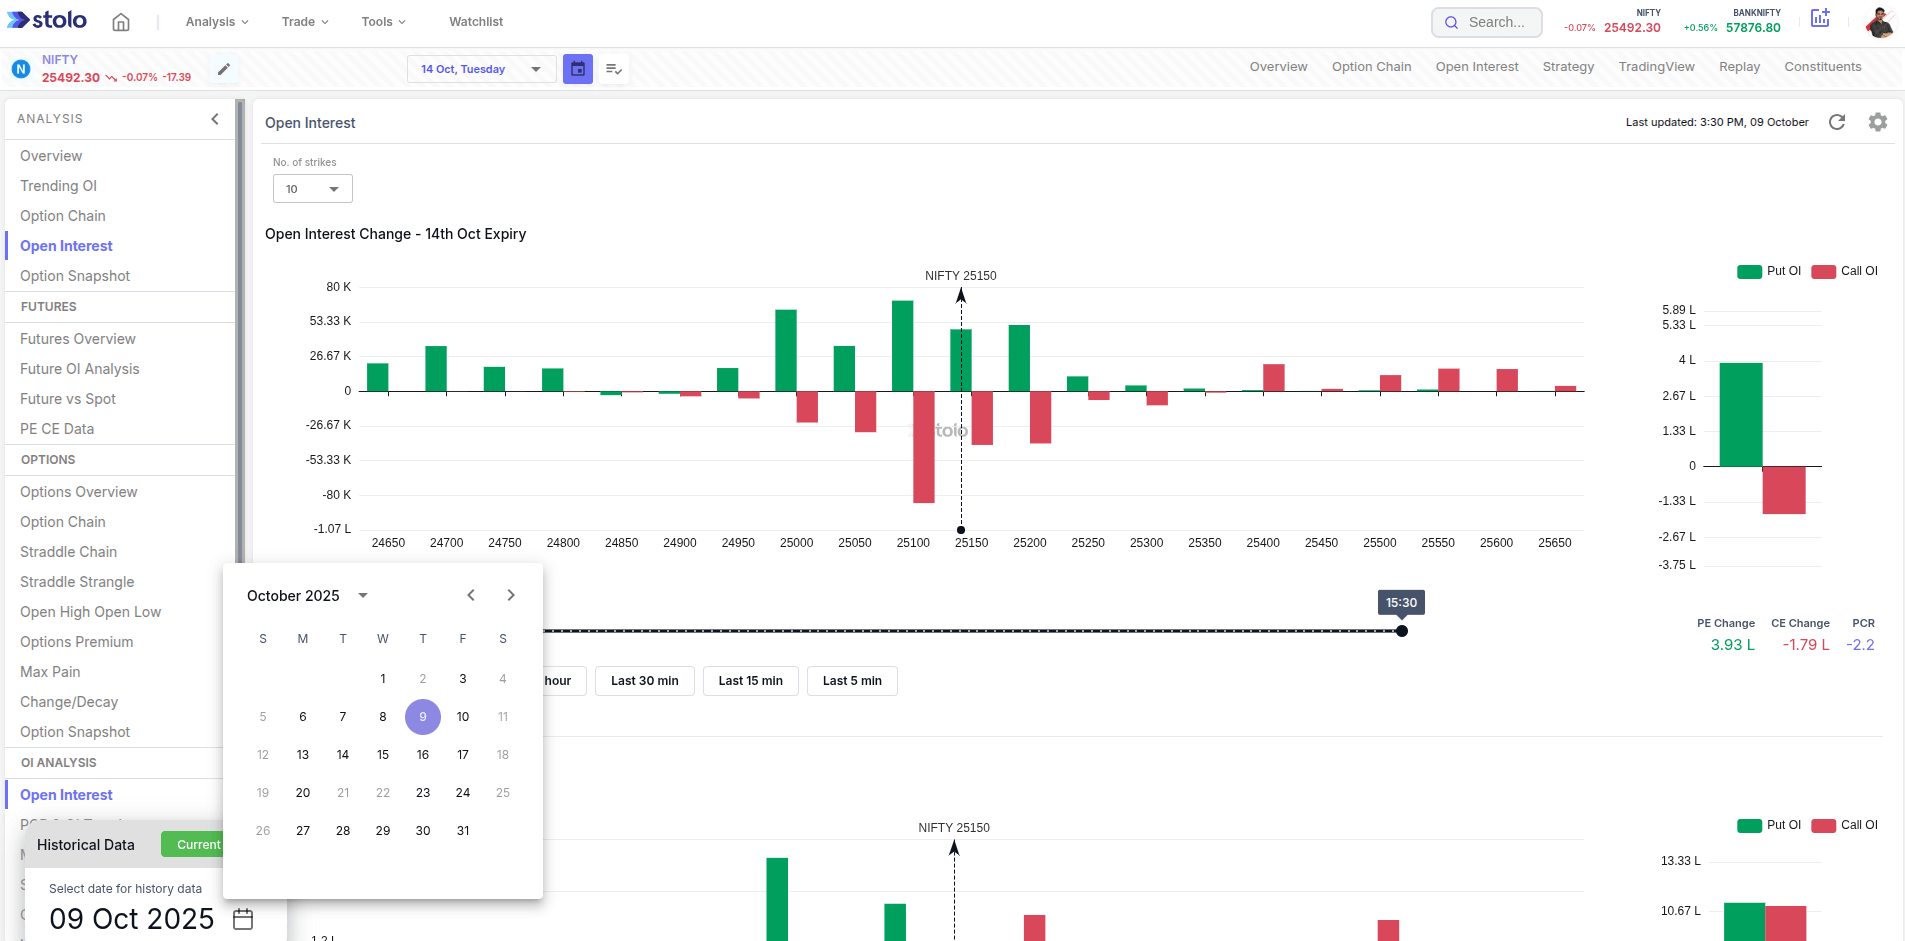
- A history date picker to load a past session.
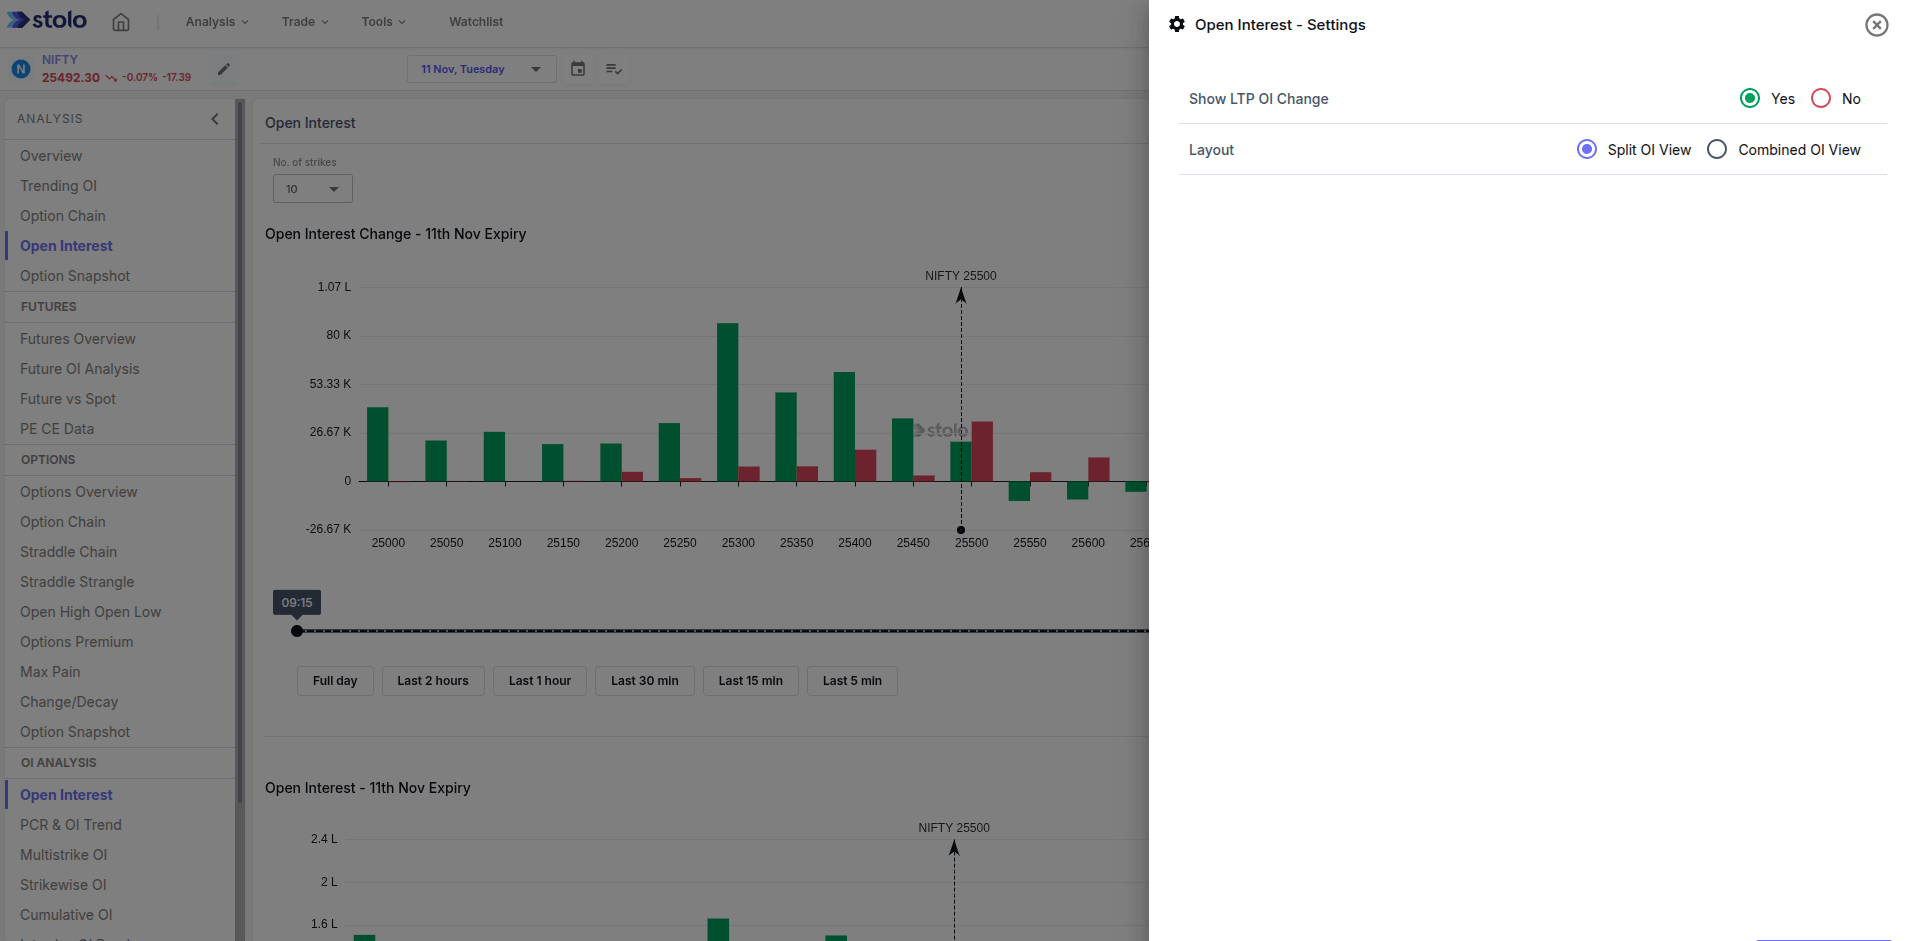
- Customisable chart colours for readability and accessibility.
A worked example
NIFTY is at 22,050, one day before weekly expiry.
- 22,100 CE: OI up 40 percent on the session, premium down. Label: short buildup. Call writers are defending 22,100 as resistance.
- 22,000 PE: the largest put OI on the chain, roughly flat today. A stable put wall acting as support.
- 21,900 PE: OI up sharply in the last 15 minutes, premium down. Fresh short buildup on the put side, so put writers are now also defending 21,900.
The read: the market is boxed between 21,900 and 22,100 by writers positioning for an expiry pin near 22,000. A trader might sell the 21,900 to 22,100 strangle, then watch the change-in-OI view. If the 22,100 call OI starts unwinding while price pushes up, the resistance is breaking and the call leg needs managing.
How to use it in Stolo
- Open Analysis from the top menu, then Options, then Open Interest.
- Choose your index or stock, for example NIFTY or BANKNIFTY.
- Pick the expiry and the time interval.
- Read the change-in-OI chart and the buildup labels across strikes.
- Hover any bar for the exact call and put OI figures.
- Switch to a past date to compare today's positioning with a previous session.
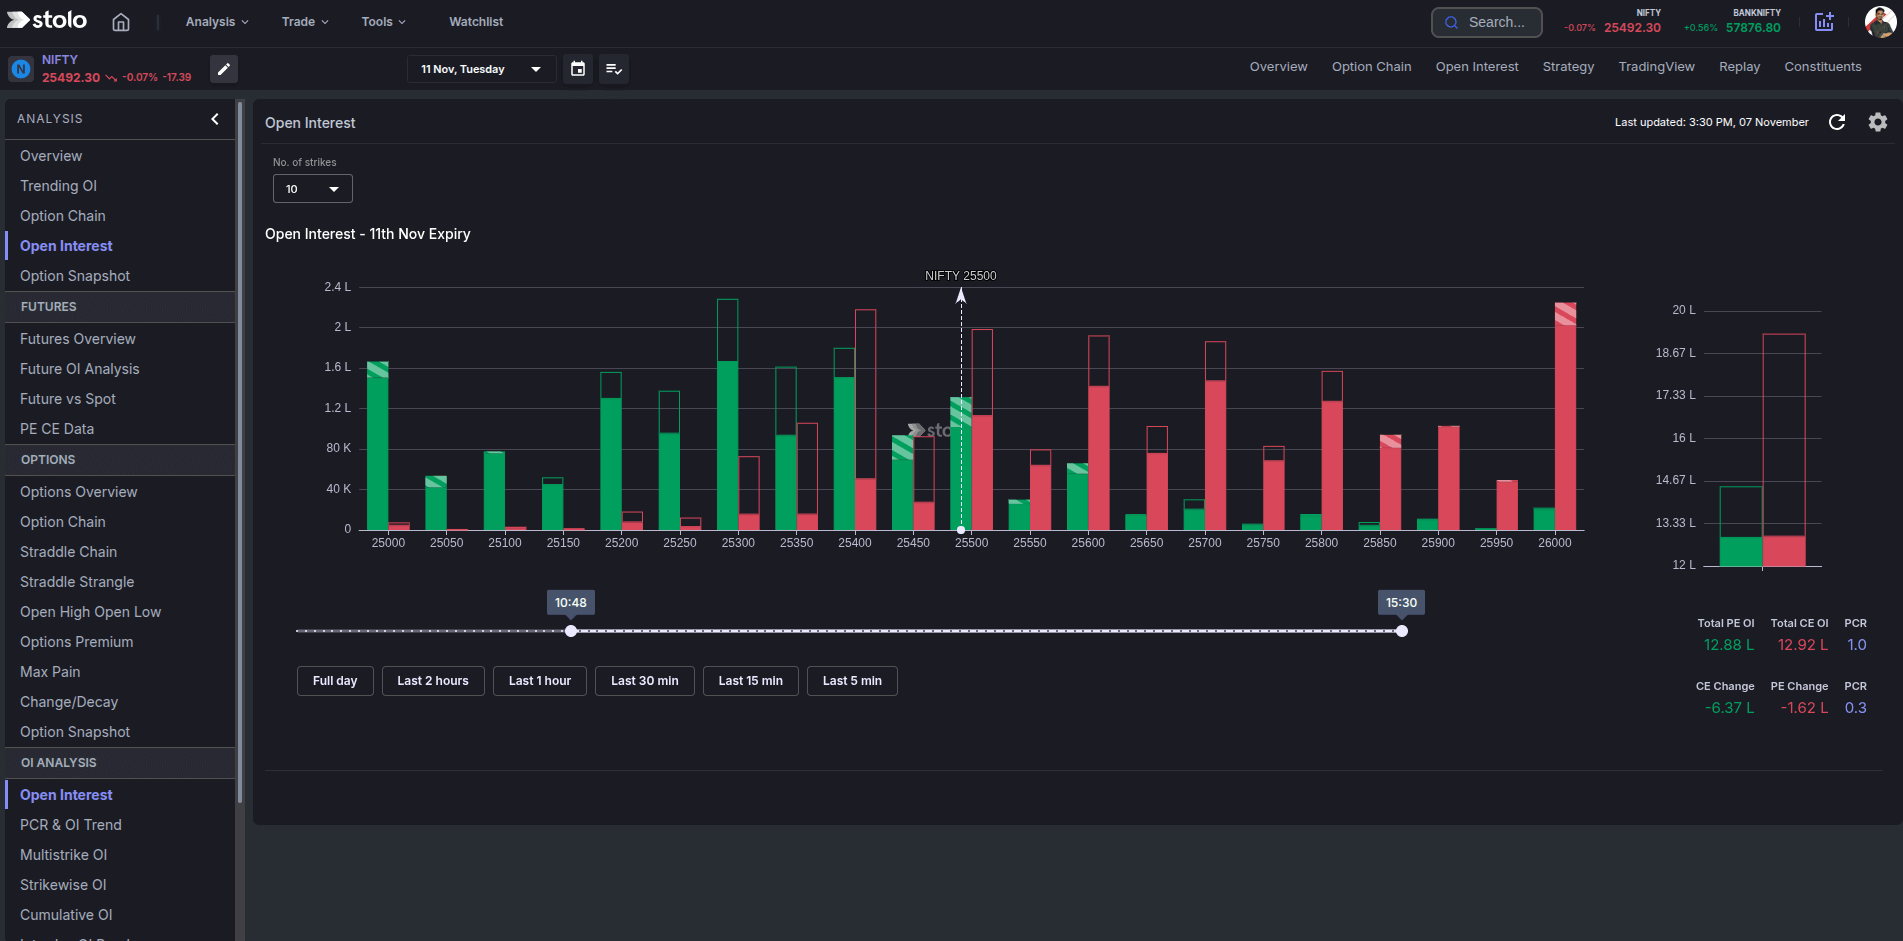
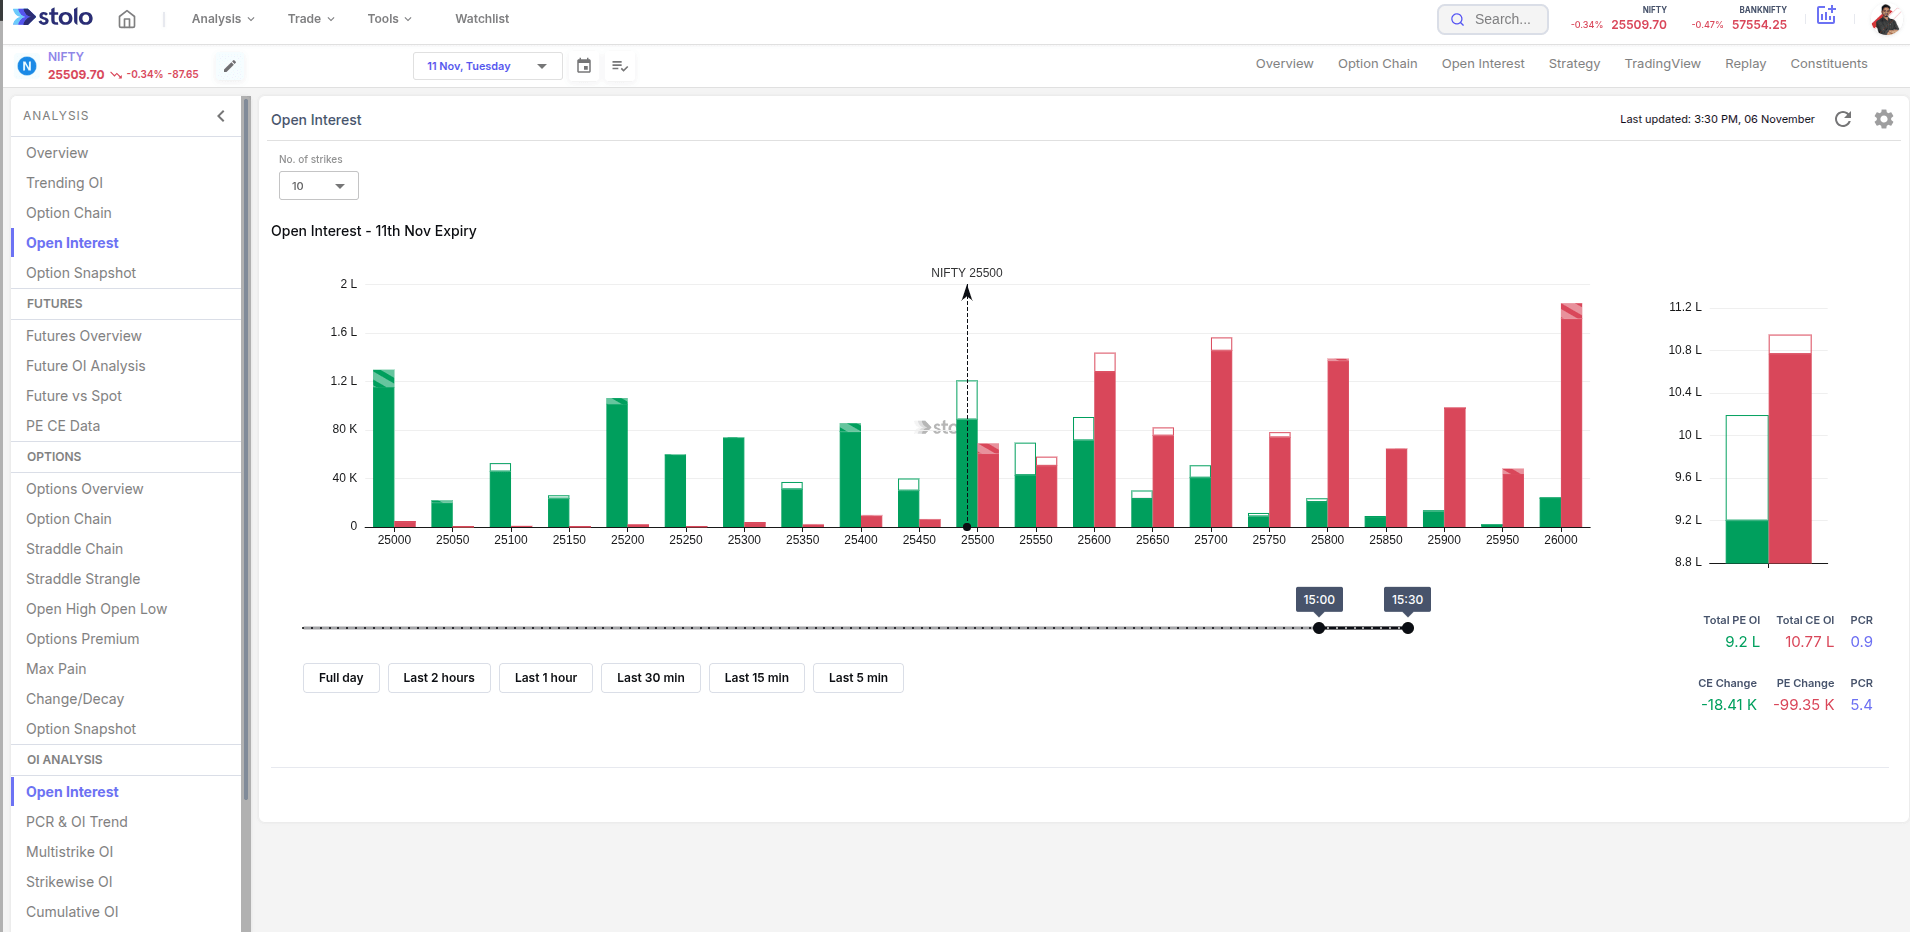
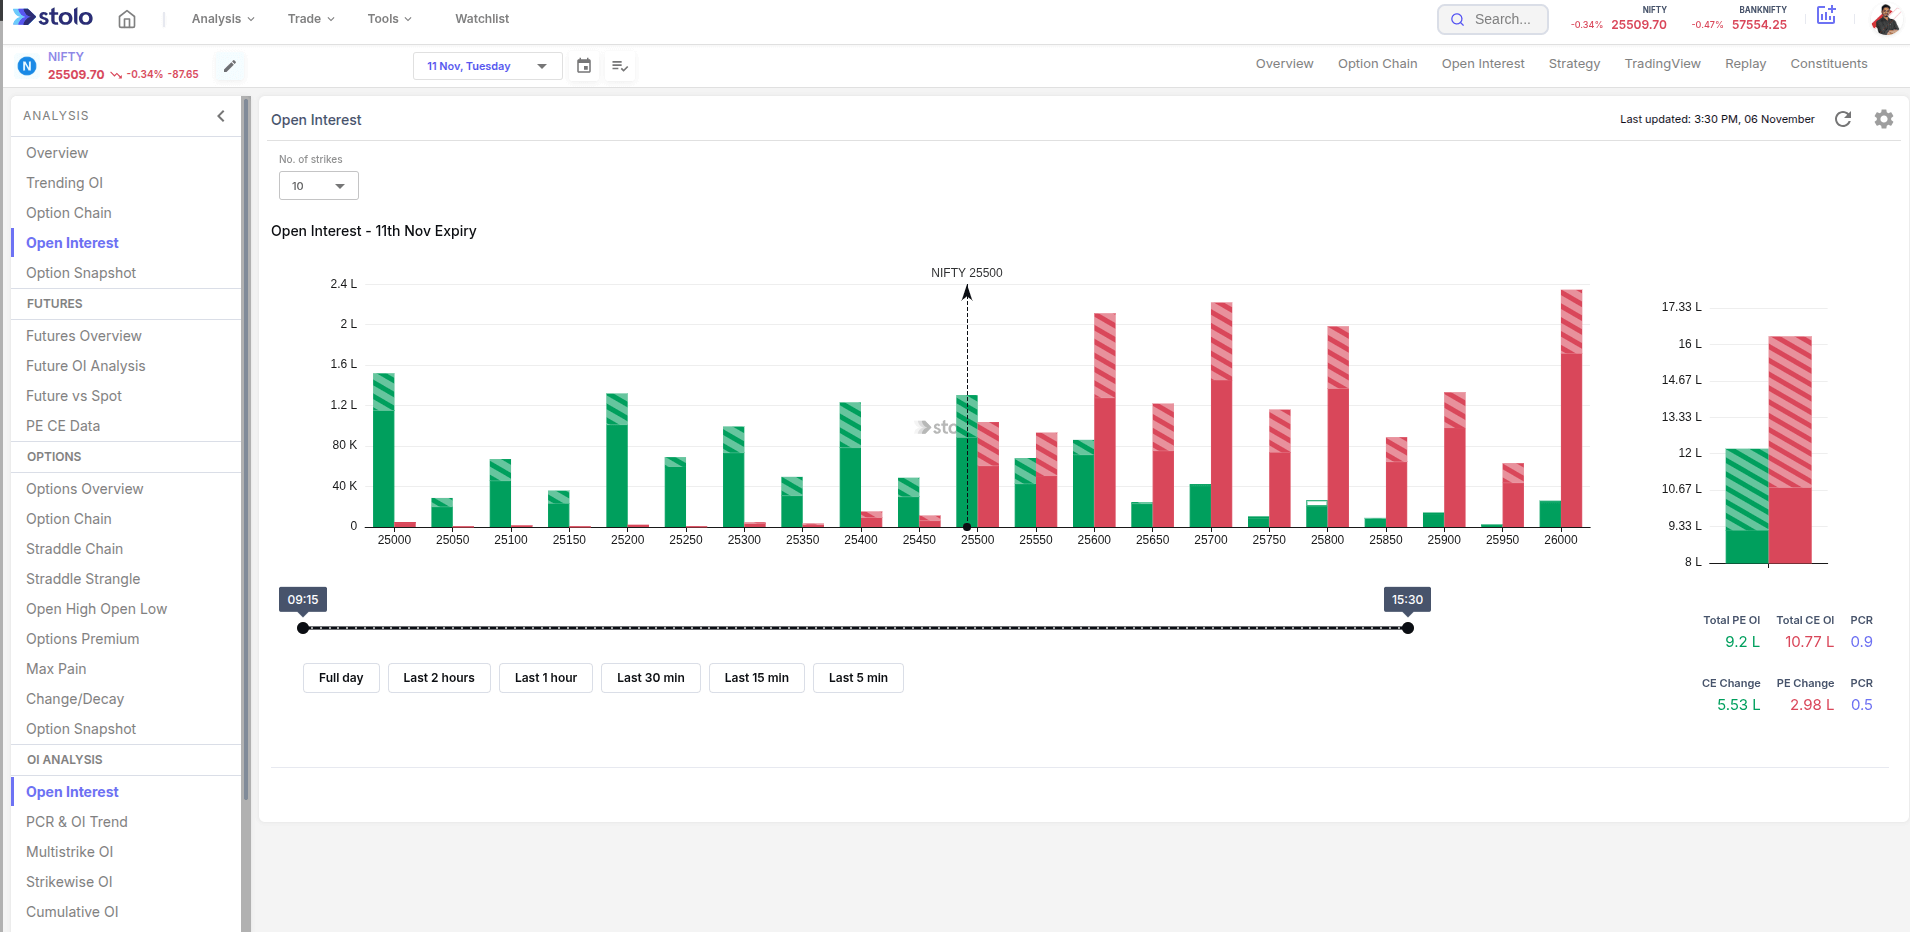
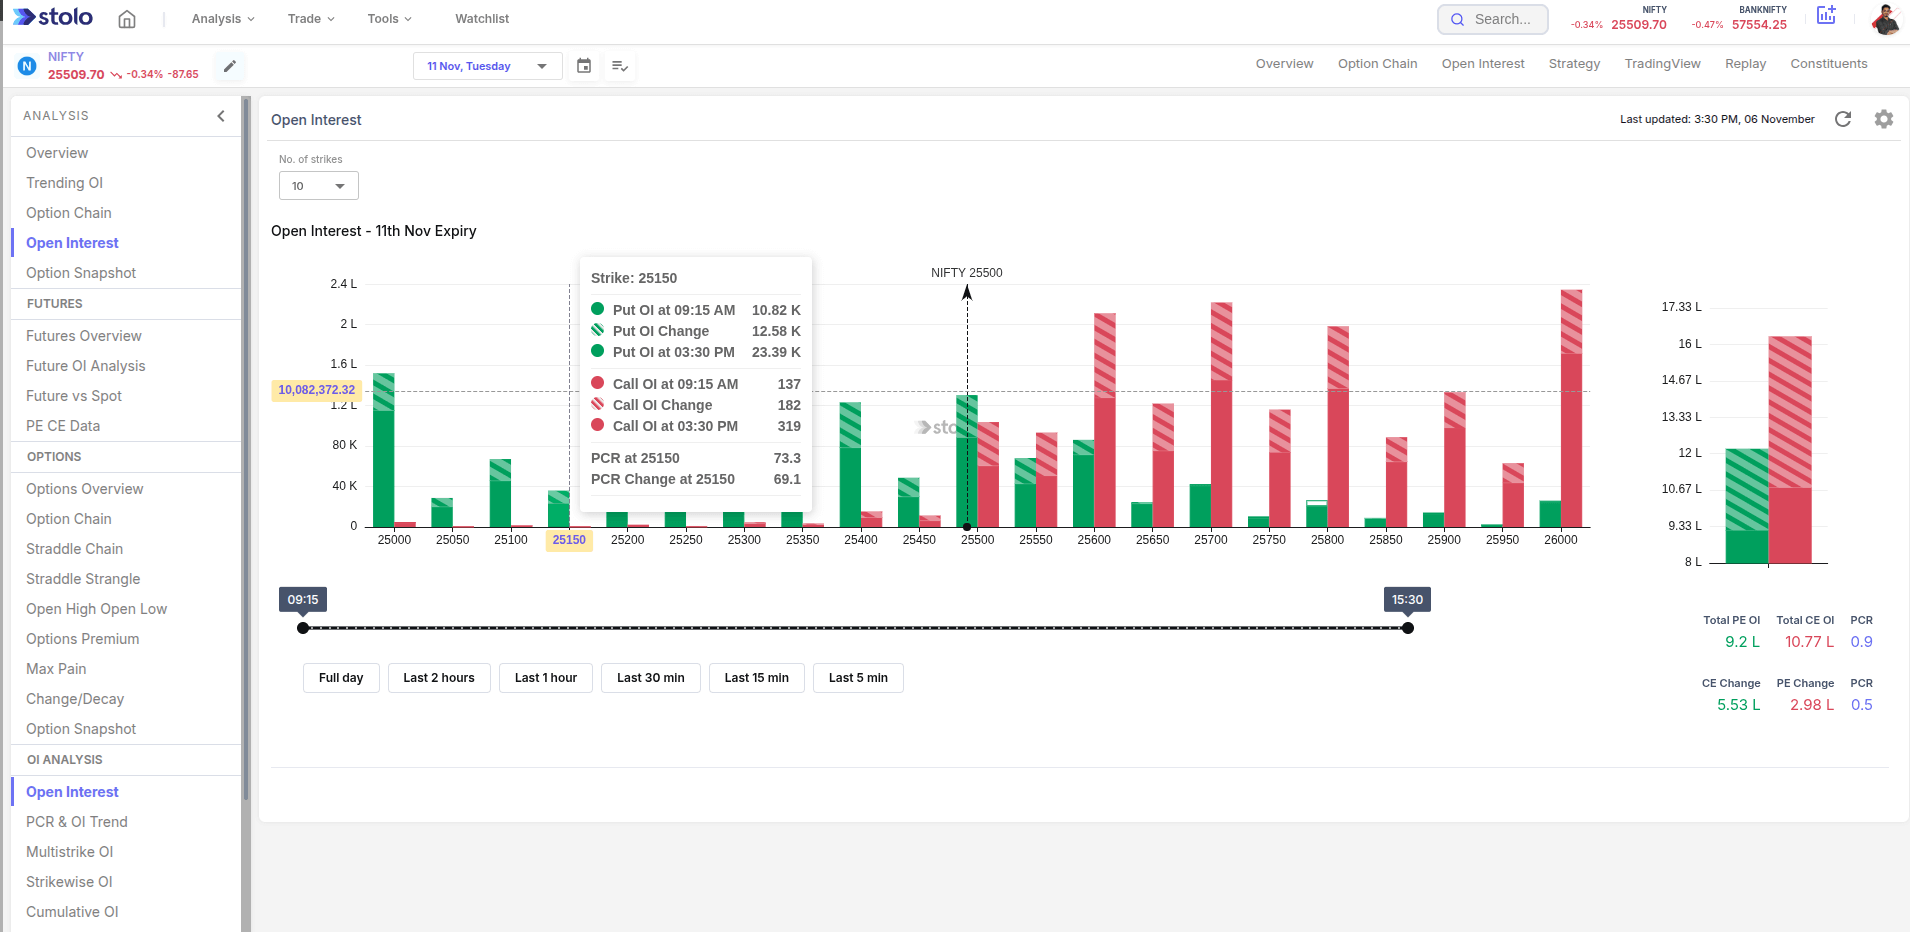
Put the change-in-OI view next to a price view. OI change plus price direction is what gives you the buildup type, and that is the actionable read, not the raw OI number.
How traders use it
- Expiry pinning. Heavy, stable call and put OI on either side of price flags a likely pin between them.
- Breakout confirmation. A price break holds better when the OI at the level it broke is unwinding, not still growing.
- Support and resistance mapping. Mark the call wall and put wall before the session as your levels for the day.
- Fade setups. A strike with fresh, aggressive short buildup is a level the writers expect to hold, which momentum traders fade and mean-reversion traders lean on.
Live mode and history mode
Live mode streams the buildup through the session. History mode redraws OI for a date you pick, so you can study how positioning looked before a past expiry or event and recognise the pattern when it forms again.
Frequently asked questions
What is open interest in options trading?
How is open interest different from volume?
What does rising call open interest mean?
What are the four OI buildup types?
How do I use OI to find support and resistance?
Does Stolo show change in OI or only absolute OI?
Can I see historical open interest on Stolo?
How often does the OI chart update?
Is a high PCR from OI bullish or bearish?
Which plan includes open interest analysis?
See what traders are doing behind the OI numbers
Open Stolo's Open Interest view for colour-coded, real-time buildup by strike on any F&O instrument.
Start with a Flexi Trial from ₹199