Open High Open Low (OHOL) for F&O
The first few minutes of the session set the tone, and an instrument that has not traded back through its opening price is showing one-sided pressure. Open High Open Low in Stolo scans the F&O list for exactly that: names opening at their high (bearish) or their low (bullish), laid out in a table with the hit time and day range so you can align with the early trend.
The problem it solves
Spotting Open equals High or Open equals Low means watching the opening price against the running high and low for dozens of instruments, which is impossible by hand. And the signal is time-sensitive: it matters most early and it breaks the moment price crosses back through the open. The OHOL view does the tracking for the whole universe and updates as conditions form and break.
The concept
- Open equals Low (O equals L). The instrument opened at its lowest point of the day and has only traded up since. Early bullish momentum. Look for longs.
- Open equals High (O equals H). It opened at its highest point and has only traded down. Early bearish momentum. Look for shorts.
- The open is the line. A trade back through the opening price invalidates the setup, which makes the open a natural, tight stop level.
- Time held is conviction. A condition met at 9:20 that still holds at noon is far stronger than one first met at 11:30.
Key terms explained
| Term | What it means |
|---|---|
| O equals L | Open equals the day's low so far. Bullish. |
| O equals H | Open equals the day's high so far. Bearish. |
| Hit time | The clock time the condition was first satisfied. |
| Day open | The opening price, which is also the stop reference. |
| New day high / low | The extreme reached after the open. |
| Condition break | Price trading back through the open, dropping the symbol off the list. |
A worked example
At 9:22 the OHOL view shows RELIANCE forming O equals L: it opened at 2,900, which is still the low, and has ticked up to 2,918. Hit time 9:18.
- NIFTY is also up and trending, so the market is not fighting the setup.
- A trader enters RELIANCE long around 2,920 with a stop at 2,898, just below the open. Risk is about 22 points.
- By 13:00 RELIANCE is at 2,955 and still on the O equals L list, so the pressure has held all session. The trader trails the stop up under the intraday structure.
Had RELIANCE traded back below 2,900 at any point, the setup would have broken and the trade would have been stopped for a small loss.
How to use it in Stolo
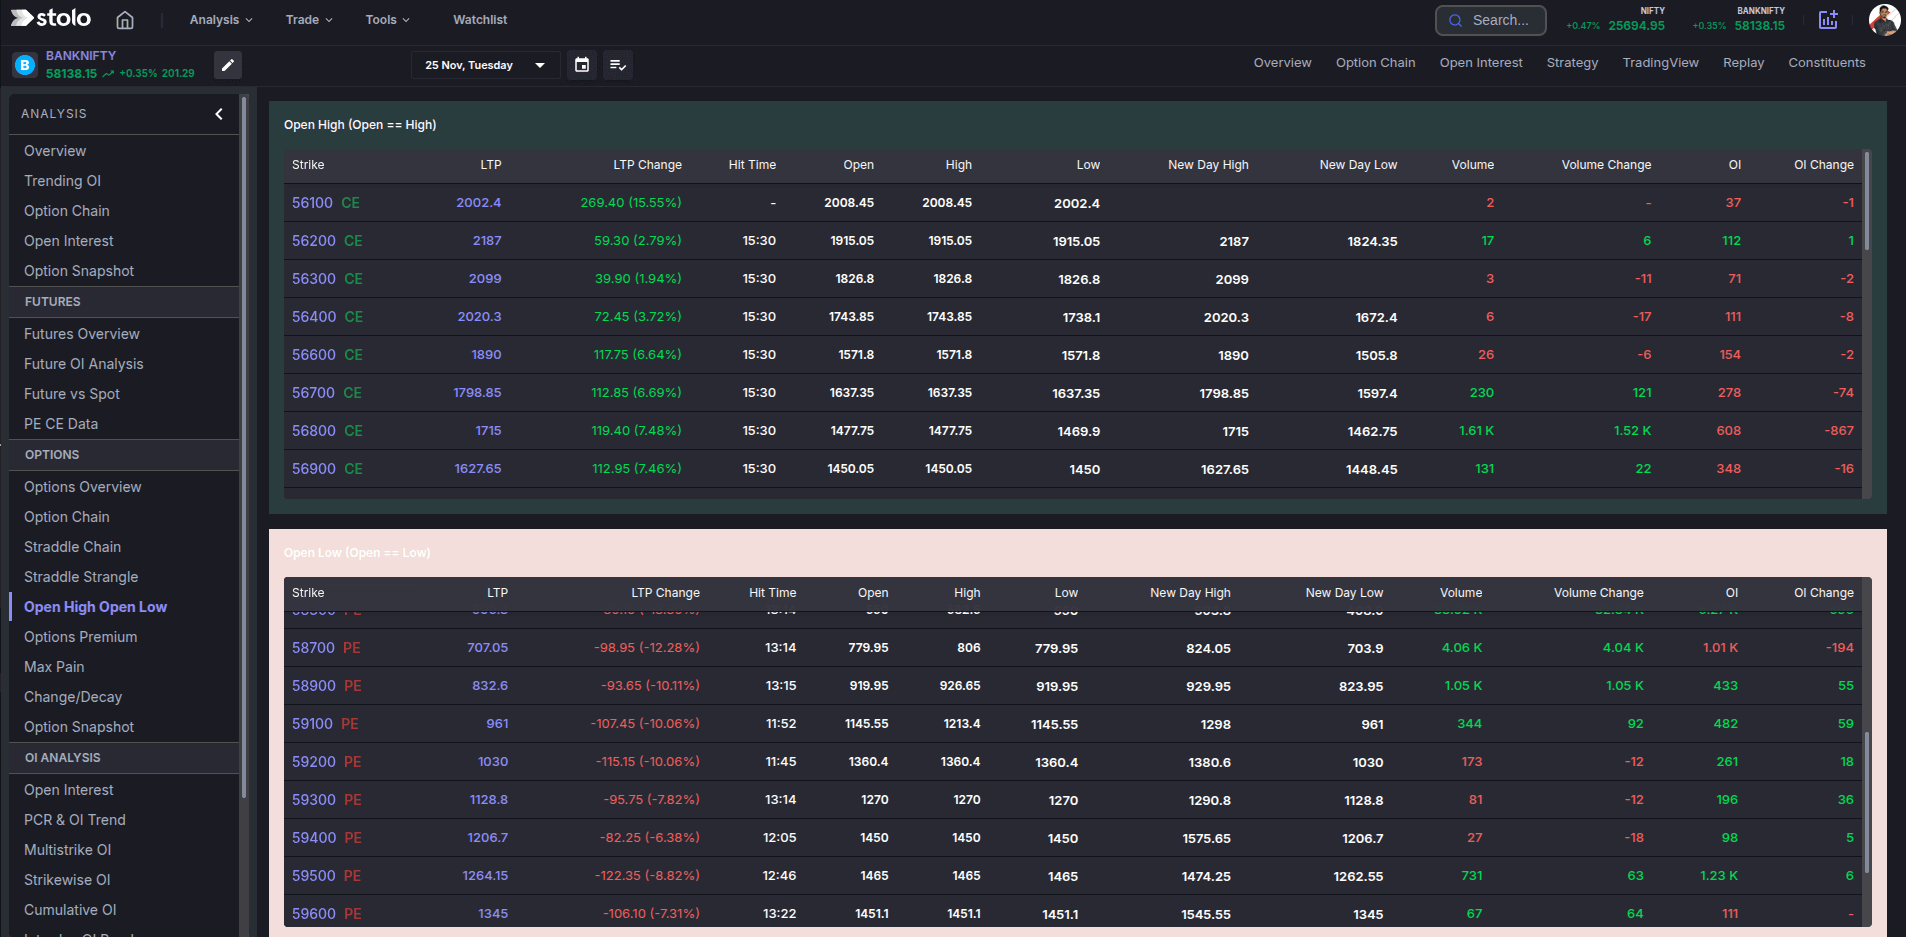
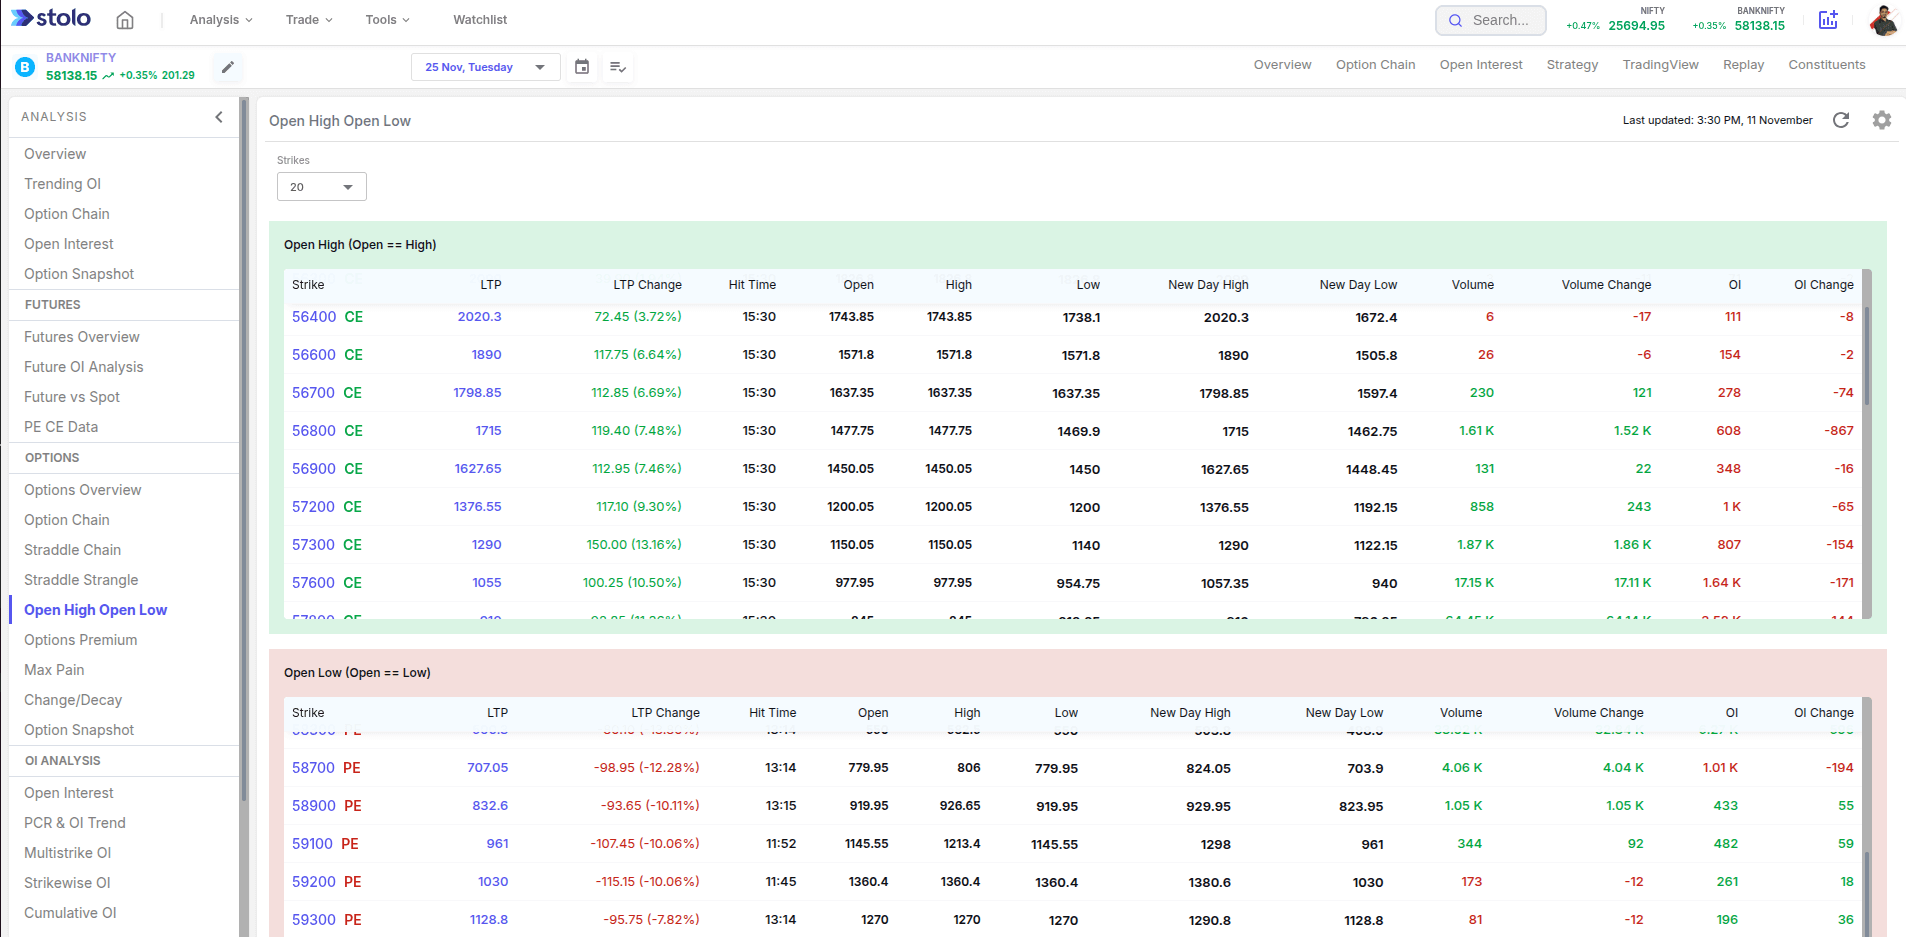
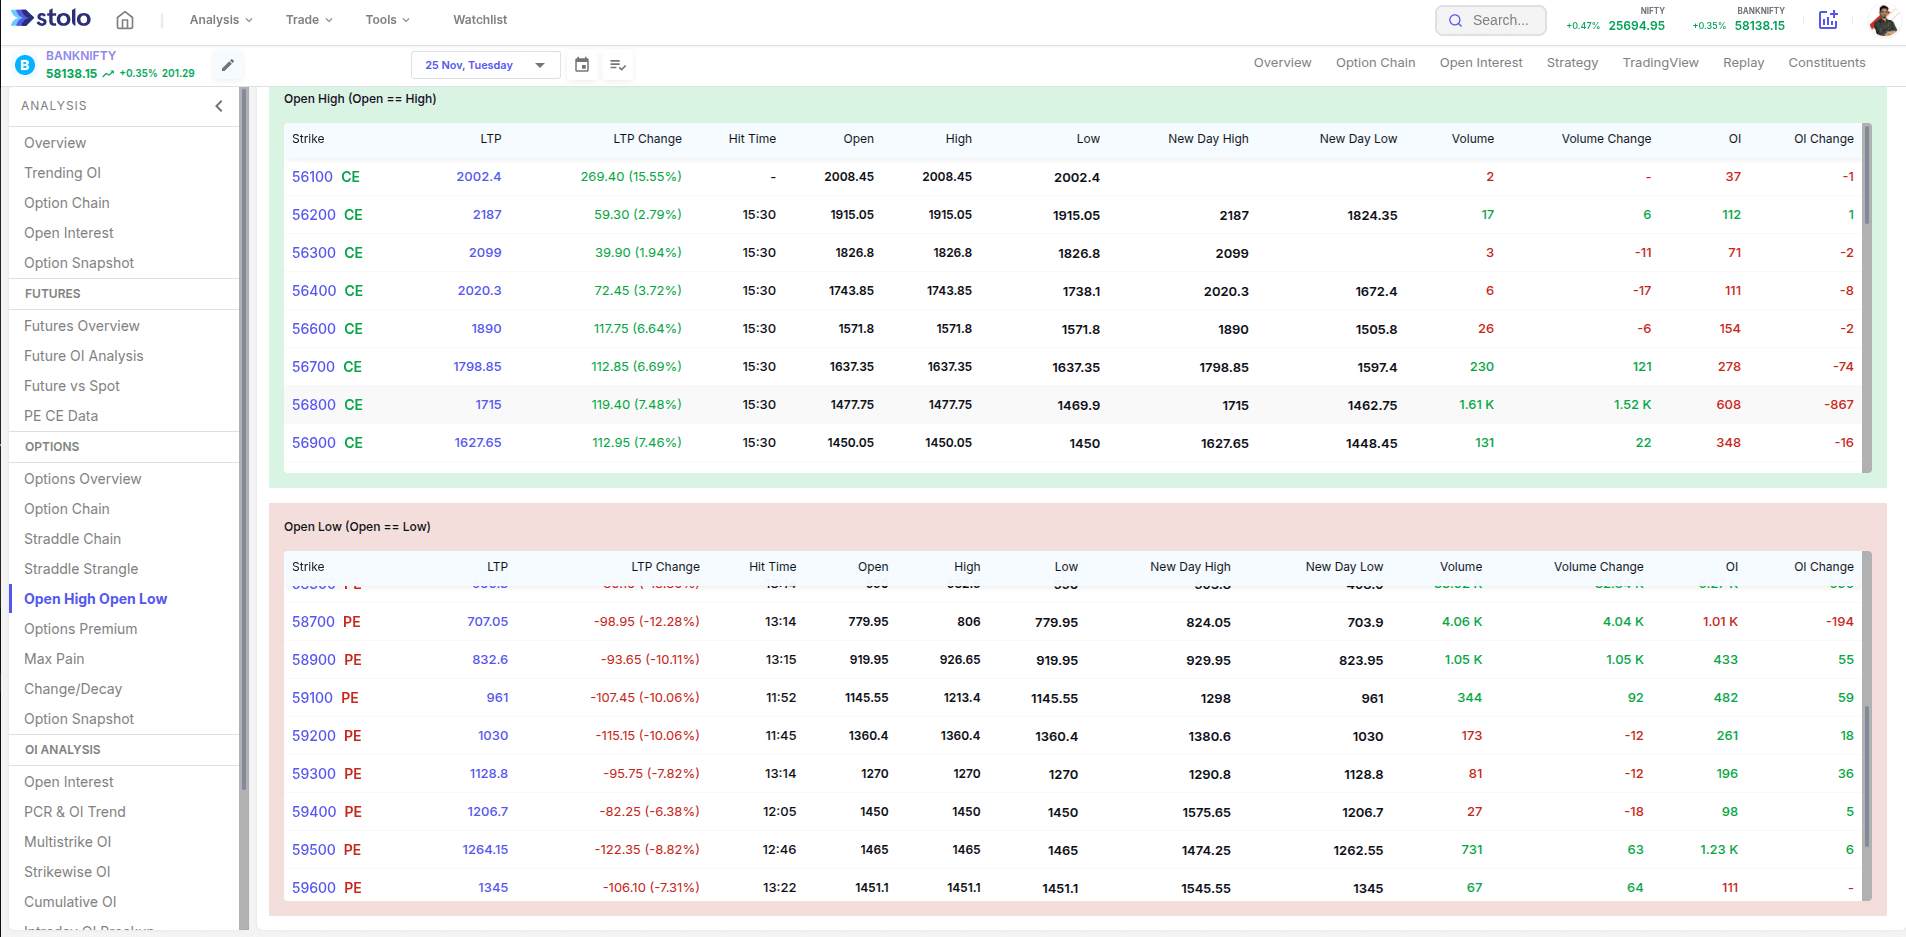
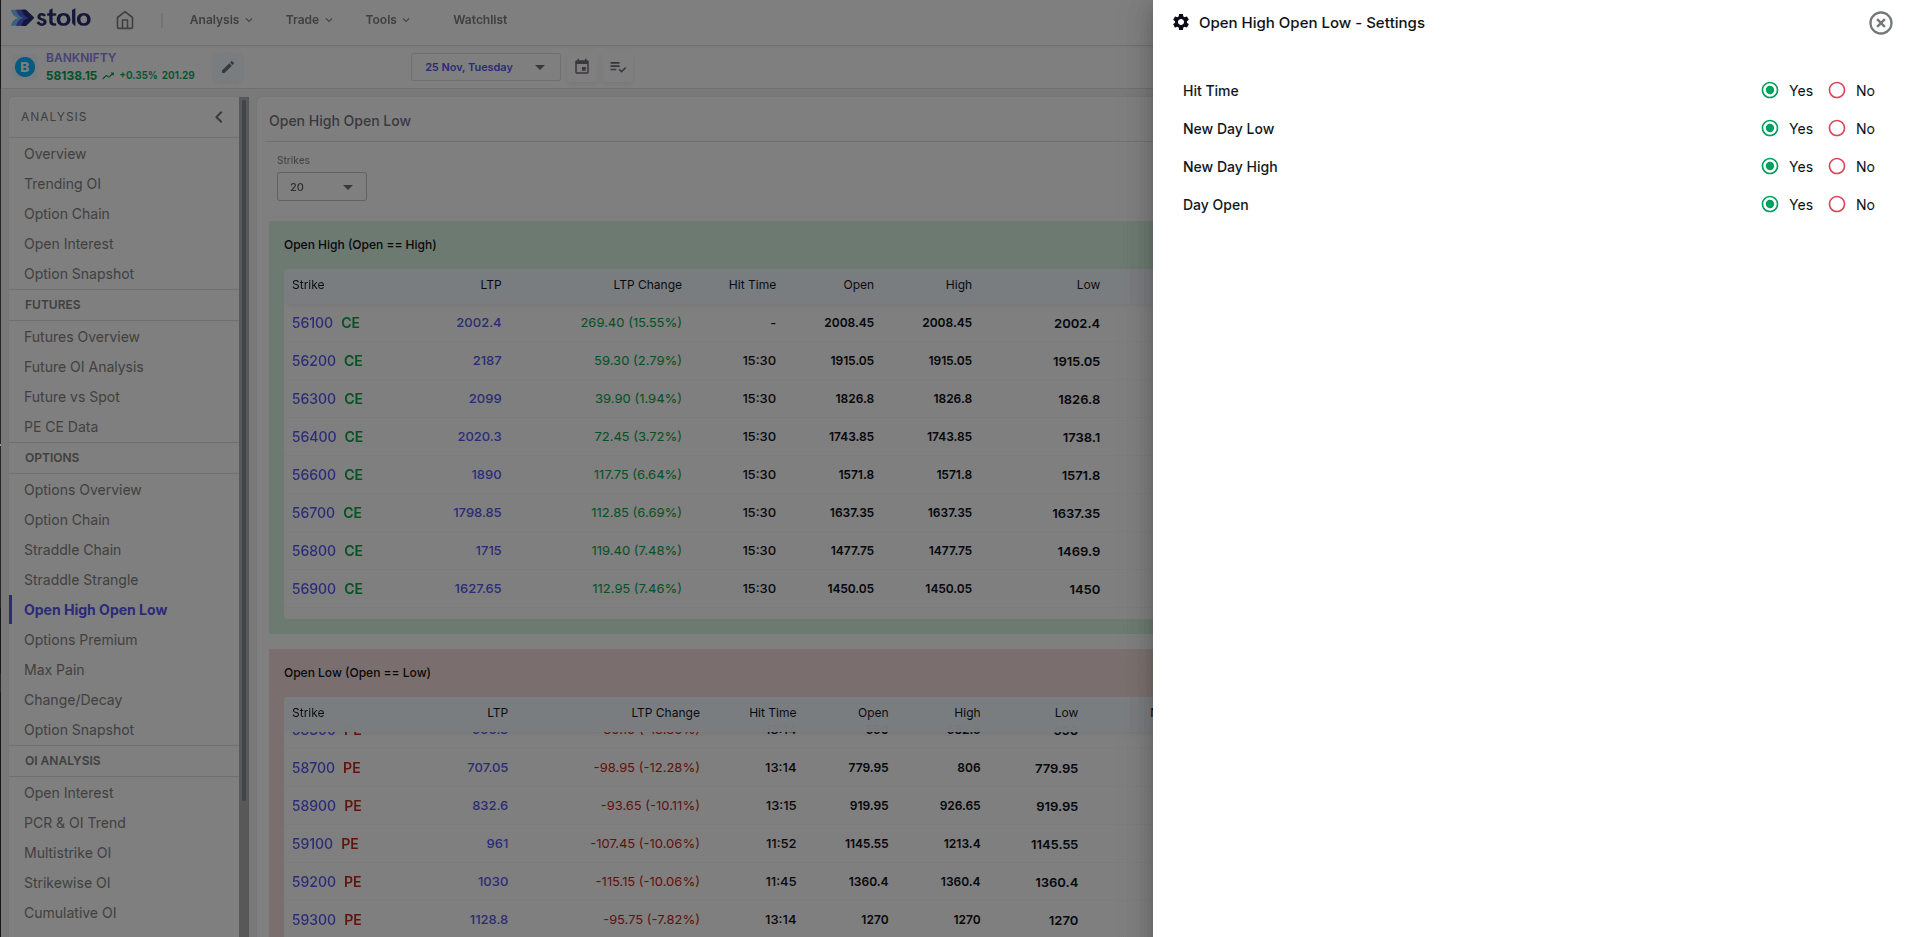
- Open Analysis, then Options, then Open High Open Low.
- Choose the segment to scan, for example NIFTY 50 or the full F&O list, and the number of strikes.
- Pick the condition: O equals H, O equals L, or both.
- Read the table: the colour indicator, the hit time, the day open, the day low or new high, and the LTP.
- Prefer rows with an early hit time that still holds, and check the broader market is moving the same way.
- Use the opening price as your stop reference for any trade you take.
The OHOL view is a momentum filter, not a trade signal on its own. Stolo does not place trades. Confirm with market direction and, for options, open interest, then execute through your connected broker.
How traders use it
- Morning shortlist. Scan O equals L for the day's early leaders and O equals H for the early laggards.
- Trend alignment. Only take an O equals L long when the index is also trending up.
- Tight-stop entries. The open gives a natural, close stop, so risk per trade is small and defined.
- Strength ranking. Names holding the condition longest are the strongest, and often the best trend trades.
Live mode and history mode
Live mode updates the list as conditions form and break through the session. Where a historical date is available, you can review which instruments held O equals H or O equals L on a past session to study how the setup resolved.
Frequently asked questions
What is Open High Open Low?
Why does the Open High Open Low pattern matter?
What does the OHOL view in Stolo show?
Does a symbol stay on the list all day?
Can I choose which universe to scan?
What is the hit time column?
How do traders trade the OHOL setup?
Can I customise the columns?
Is the OHOL pattern reliable on its own?
Which plan includes the Open High Open Low view?
Catch the day's momentum from the open
Open Stolo's Open High Open Low view to flag O equals H and O equals L setups across the F&O list with hit time and day range.
Start with the Trial Plan at just ₹499