Sectors Analysis: Track Sector Strength and Rotation
Markets move in themes. Some sectors lead, others quietly roll over, and the headline index hides most of it. Stolo's Sectors Analysis puts sector breadth, a strongest-to-weakest performance distribution and live sector index charts on one screen, so you can see which groups the money is in and trade with them.
The problem it solves
Trading only the NIFTY or BANKNIFTY chart misses the story underneath: whether the rally is broad or narrow, which sectors are driving it, and whether defensives are outperforming cyclicals. Piecing that together on most platforms means jumping across pages. This view brings breadth, distribution and the sector charts together.
What the view shows
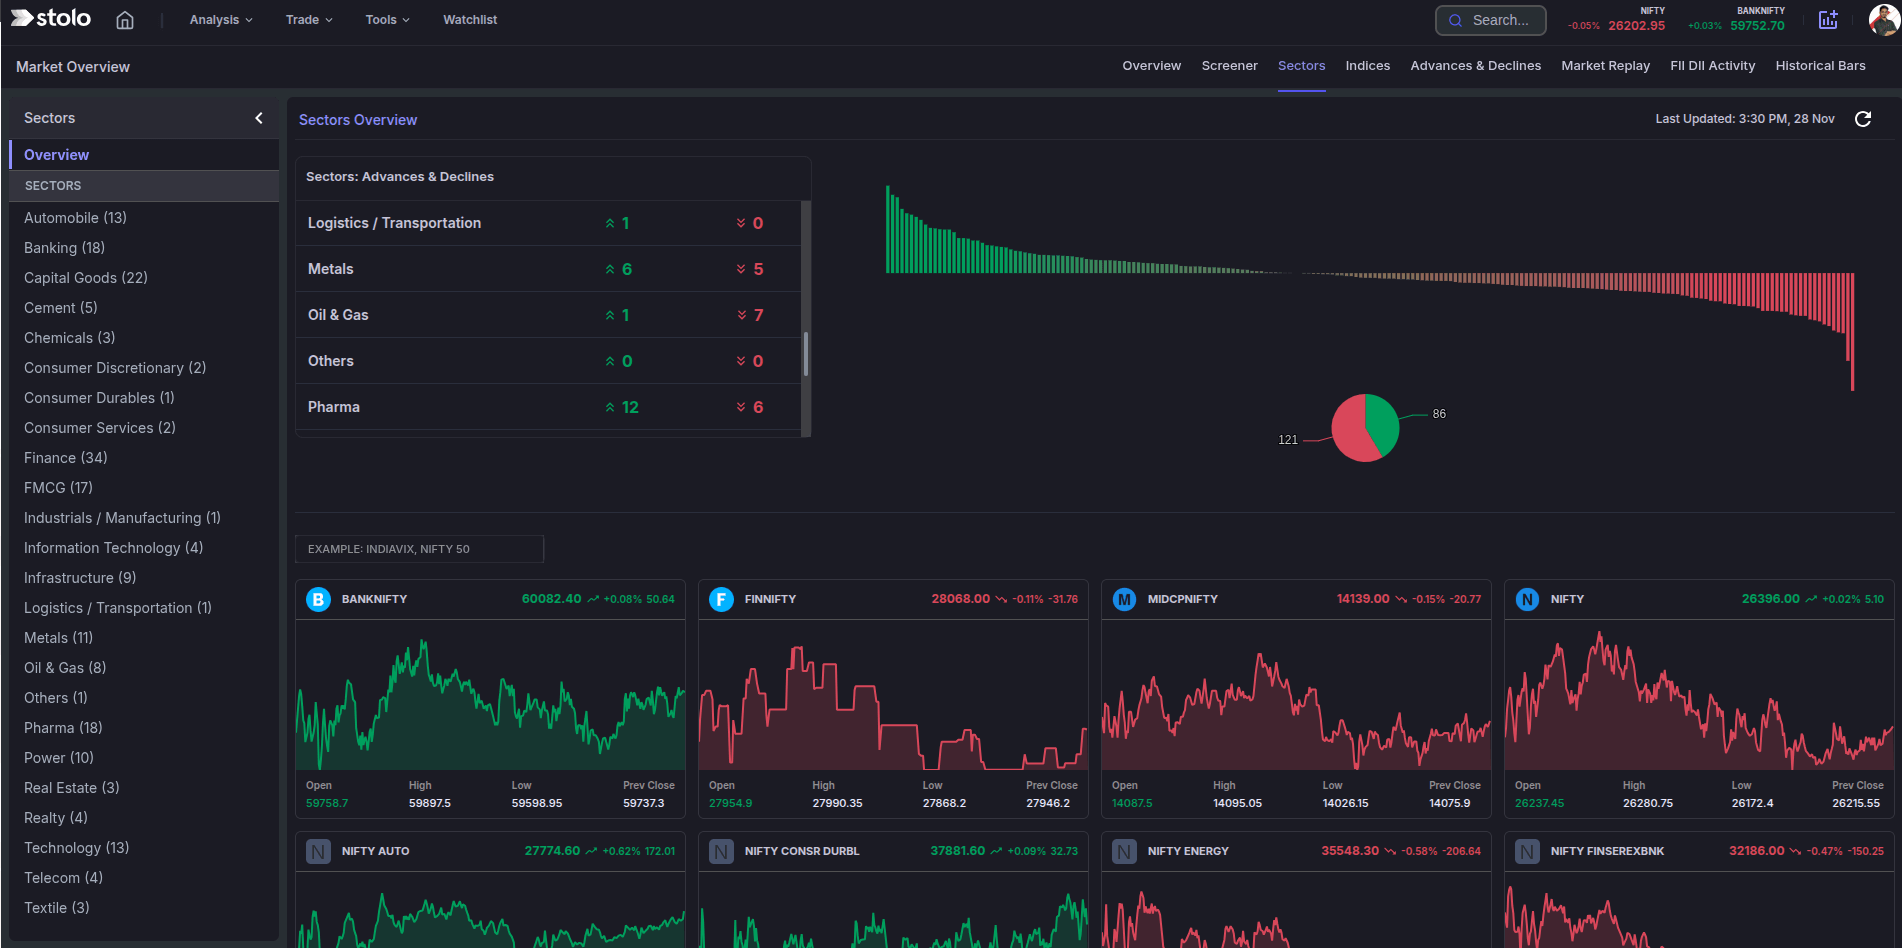
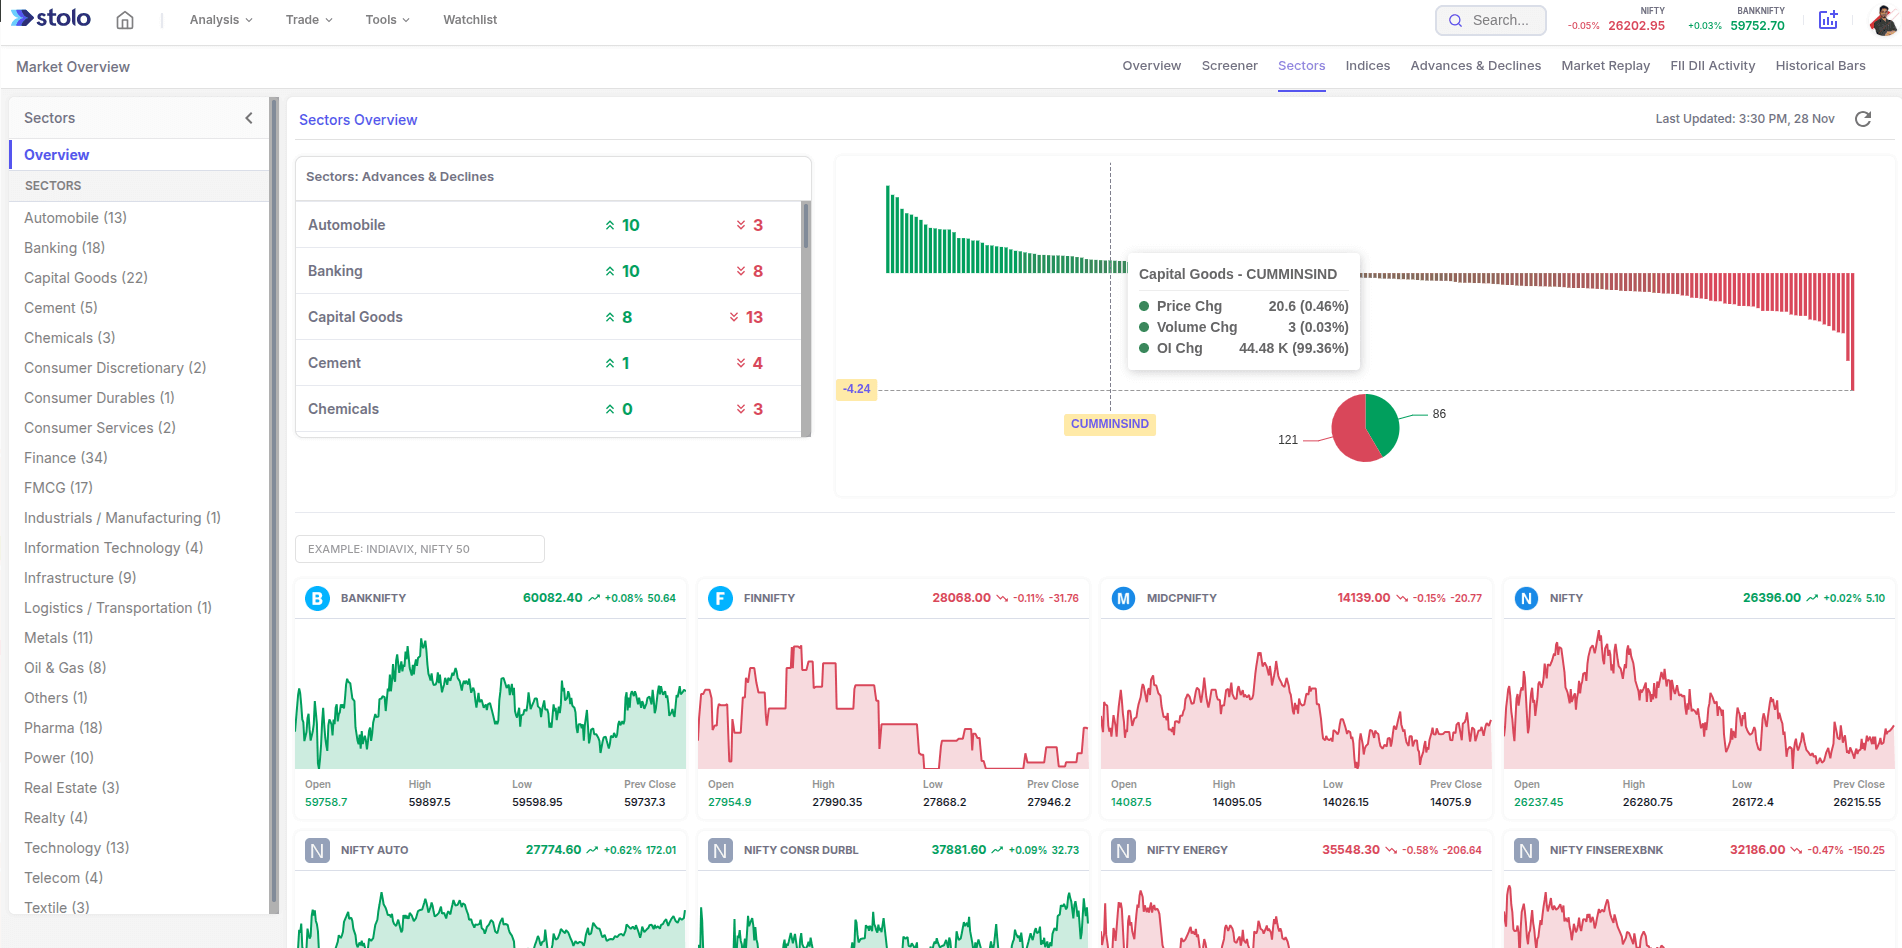
- Sector advances and declines. For each sector, the number of advancing versus declining constituents, with quick green and red counts.
- Performance distribution chart. A bar chart of all the sector indices from strongest to weakest, with a red to green split for overall breadth.
- Live sector index cards. An intraday mini-chart, LTP, percentage change and OHLC for each sector index.
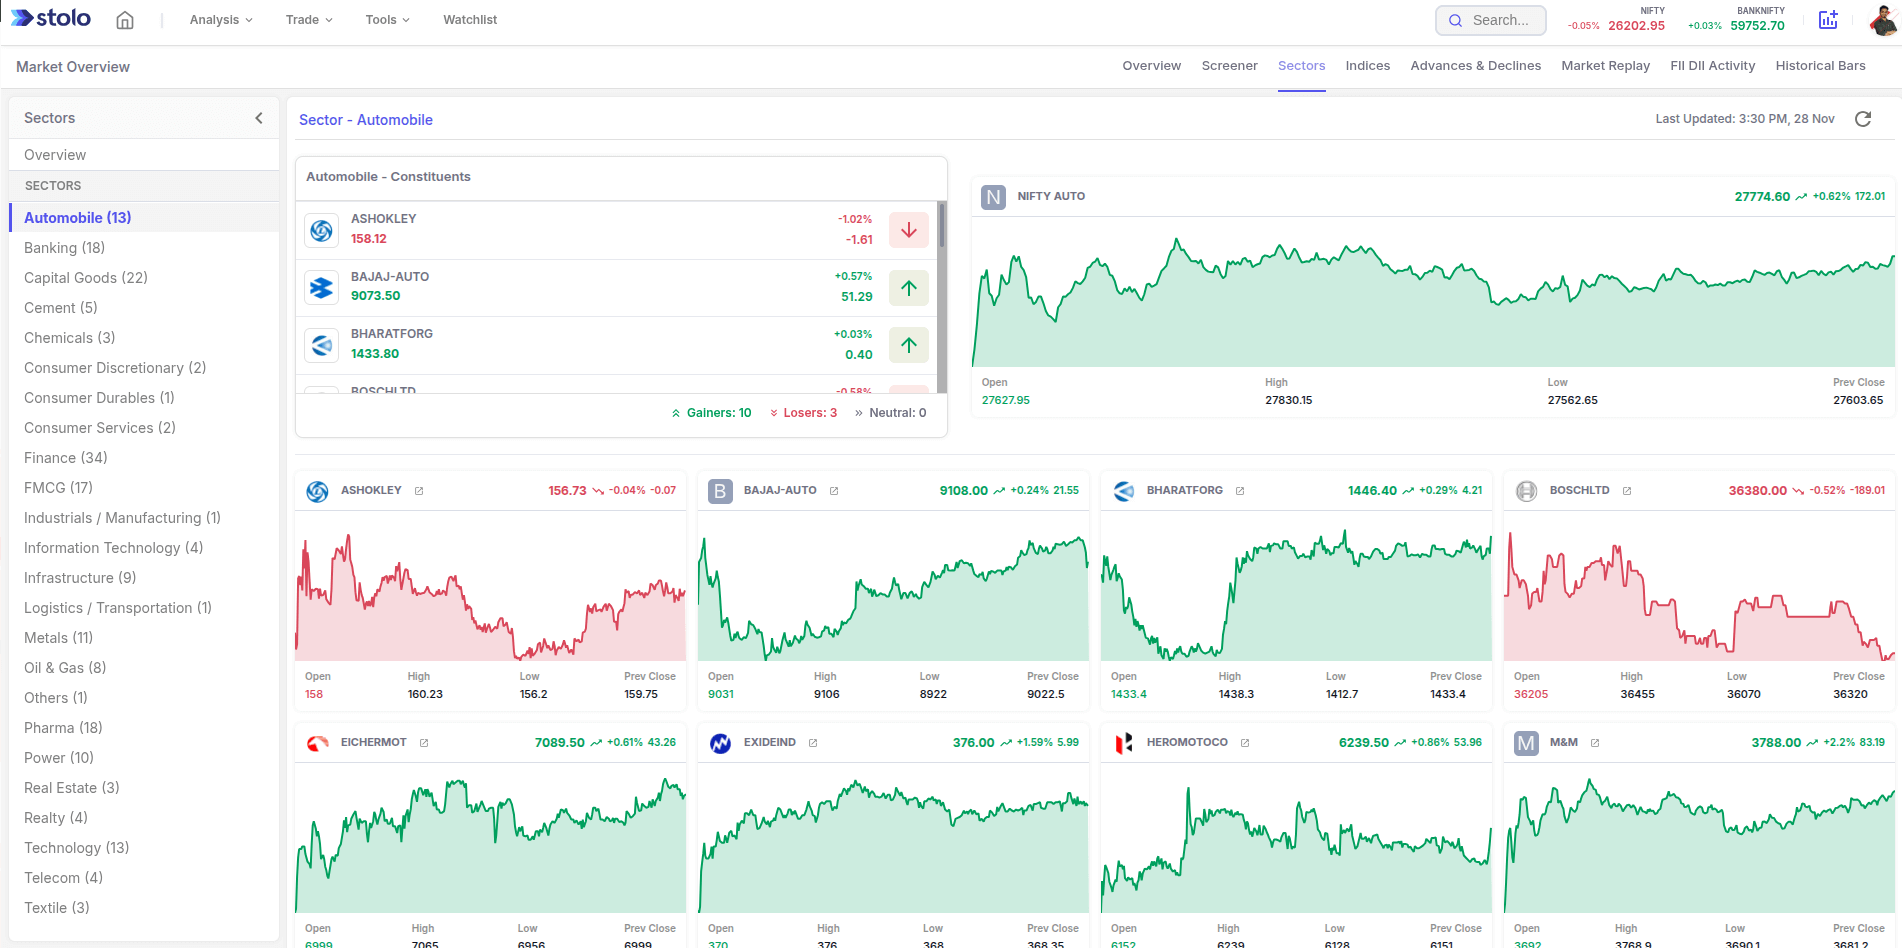
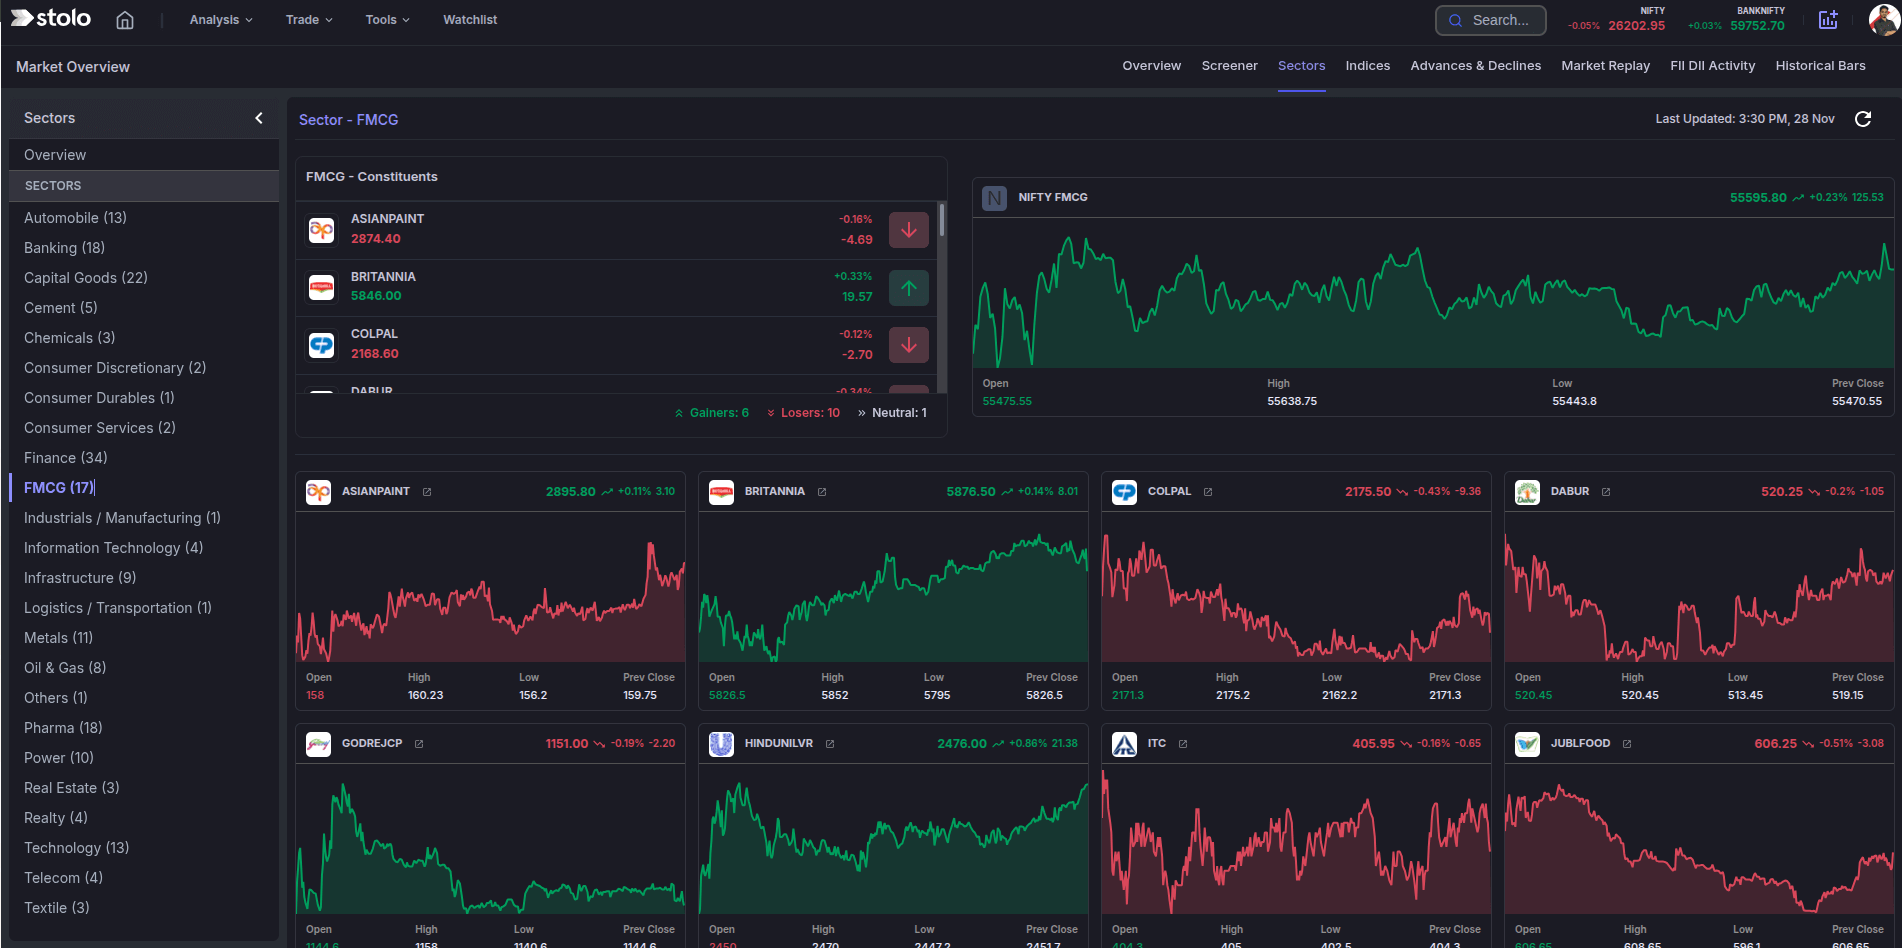
- Sector list and navigation. The full list of sectors to drill into constituents and individual stocks.
Key terms explained
| Term | What it means |
|---|---|
| Sector index | An NSE index of the stocks in one industry, such as NIFTY BANK or NIFTY IT. |
| Sector breadth | Advancing versus declining constituents within a sector. |
| Rotation | Capital moving from one sector to another as the market's theme shifts. |
| Distribution | The ranking of all sectors from strongest to weakest on the day. |
| Broad vs narrow | Whether a sector move is shared across its stocks or carried by a few. |
A worked example
At 10:30 the performance distribution chart shows NIFTY METAL up 1.8 percent at the top and NIFTY FMCG down 0.6 percent at the bottom. The rest are clustered near flat.
- In the advances and declines panel, Metal shows 9 of 11 constituents green: a broad move.
- FMCG shows 3 of 15 green: broadly sold.
The read: money is rotating into cyclicals and out of defensives, and the Metal move is real, not one stock. A trader looking for an intraday long focuses on the strongest Metal names, checks each in the Market Screener for OI support, and avoids FMCG entirely for the session.
How to use it in Stolo
- Open Analysis, then Sectors Analysis under the Market Sentiment section.
- Read the performance distribution chart for the day's leaders and laggards.
- Check the advances and declines panel to see which sector moves are broad and which are narrow.
- Scroll the sector index cards for the intraday shape and OHLC of each.
- Use the sector list to drill into a strong sector's stocks.
- Come back through the day to catch a sector flipping, which is rotation starting.
Trade the stock with the sector and the sector with the market. When all three line up, a trend trade has the best odds.
How traders use it
- Focus list. Trade only within the top two or three sectors on the distribution chart.
- Rotation catch. A sector block turning green day after day is the one to move into.
- Breadth check. Confirm a sector move is broad before trusting the sector index breakout.
- Pair ideas. Long the strongest sector, short the weakest, for a market-neutral trade.
Frequently asked questions
What is sector analysis?
What does the Sectors Analysis view in Stolo show?
What is sector rotation?
How do I tell if a sector move is broad or narrow?
What is the performance distribution chart?
Which sector indices does Stolo track?
How often does Sectors Analysis update?
How do I use sector analysis before an intraday trade?
Can I drill from a sector into its stocks?
Which plan includes Sectors Analysis?
Trade with the strongest sectors
Open Stolo's Sectors Analysis for sector breadth, a strongest-to-weakest distribution and live sector index charts on one screen.
Start with a Flexi Trial from ₹199