Trader Voices
Why Smart Traders Choose Stolo?
Every trade is a small bet on a dream, backed by risk and a decision you have to own. Stolo is built for traders who bring purpose and discipline to that decision, not just numbers.
Strikewise OI Analysis tool - Maximise your returns and minimise risks with strike-wise OI analysis on Stolo, India's Ultimate Options Trading Platform.
No credit card required · Trial Plan available · Setup in 3 minutes
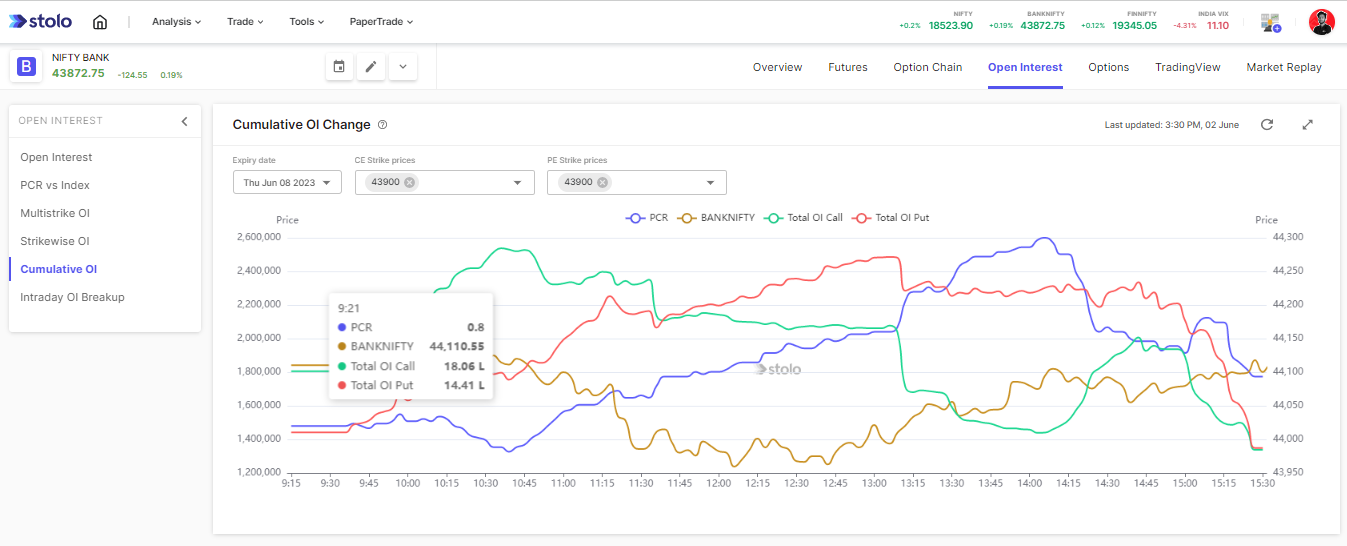
Price alone does not show you where institutional money is committed. Without OI distribution across strikes, every level you draw is a guess, not a read.
Technical levels drawn from candlesticks are subjective and shift with every trader who draws them. Strikewise OI shows you the levels backed by actual capital, strikes where option writers have positioned real money to defend a price.
The strike where options buyers lose the most on expiry day (max pain) is invisible without a strikewise OI view. Traders who do not track it regularly get caught when the index gravitates toward it in the final hours of an expiry session.
A collapse in OI at a key strike is the first signal that a level is breaking down, well before price confirms it. Traders watching only price charts see the breakout after it has already moved. The signal lives in the OI data, not on the candles.
The full option chain presents dozens of columns and hundreds of rows. Identifying the high-OI strikes at a glance under intraday pressure is slow and error-prone. A visual strike-level OI chart surfaces the same information in two seconds, not two minutes.
Strikewise open interest is a strike-by-strike breakdown of outstanding options contracts. It's the fundamental lens professional F&O traders use to read market structure.
Total open interest tells you the size of the market. Strikewise OI tells you the shape of it, how that total is spread across individual strike prices. A strike with 10 lakh contracts in OI carries a very different market implication than one with 50,000, and that difference only shows up once you break the total apart.
When Call OI is significantly higher at one strike compared to all others, option writers have sold a large number of calls there. These writers have a financial incentive to prevent price from closing above that strike, so what forms is a real, money-backed resistance ceiling rather than a line someone drew on a chart.
Put OI works the other way round. High Put OI at a strike means put sellers are defending that level as a floor, wanting price to stay above it before expiry. When you see a large Put OI spike at a specific strike on Stolo, that strike is your support level, validated by open market positioning rather than guesswork.
When OI at a previously high-OI strike starts collapsing rapidly, option writers are exiting their positions and the level is no longer defended. This OI unwind typically precedes the price breakout or breakdown by several candles. Watching strikewise OI in real time gives you that advance notice before price confirms the move.
Everything you need to read OI distribution across strikes, in one focused view, with NSE-authorised data.

View real-time OI at every NSE-listed strike price for Nifty, BankNifty, and FinNifty, and spot which strikes carry the highest concentration of F&O positions instantly.

Analyse strikewise OI across up to 3 upcoming NSE expiry dates. Compare weekly and monthly expiry OI to understand how support and resistance shifts as expiry approaches.

Track strikewise OI for all 191 NSE F&O-eligible stocks and identify strike-level support and resistance for individual counters like Reliance, HDFC Bank, and Infosys.

Customise your view with up to 15 strikes on either side of the ATM, ideal for capturing OI-heavy strikes that act as real support or resistance in F&O markets.

NSE-authorised OI charts update tick-by-tick, so you're always acting on accurate data, not delayed snapshots, when reading support and resistance during live F&O sessions.

Visualise real-time Call OI distribution across strikes for any NSE index or F&O stock, and see instantly which CE strikes option writers are defending as resistance.

Map real-time Put OI across all strikes for Nifty, BankNifty and F&O stocks, and immediately identify the PE strikes with maximum OI acting as strong support floors.

Overlay index price, total OI, Call OI, and Put OI on one chart to confirm whether OI build-up is supporting or resisting price movement for sharper F&O trade timing.
By mapping real-time open interest across every strike for Nifty, BankNifty, and F&O stocks, you can spot high-conviction support and resistance zones well before price reaches them.
When you see a surge of Call OI at a specific strike, that strike is actively defended as resistance. A dense Put OI cluster signals strong support. Reading these levels from OI data gives you entries with clear, market-validated risk boundaries instead of candlestick guesses.
Try It Now

Strikewise OI analysis tracks build-up and unwinding across strikes in real time, giving you an early read on whether market participants are positioning bullish or bearish before the price move confirms it.
When Put OI is consistently added at lower strikes while Call OI thins at upper strikes, the market is signalling an uptrend. Rising Call OI with Put OI shedding points to a bearish tilt. Stolo surfaces these structural shifts so both intraday scalpers and positional traders can align strategy with actual money flows.
Start Your TrialBy examining open interest at each strike, you can identify where large option sellers are positioned. Those concentrations define your true risk boundaries and profit targets, not arbitrary price levels.
Place stop-losses just beyond high-OI support or resistance strikes, and target profits near the max pain strike where OI is heaviest. Stolo's real-time strikewise OI data means you are always working with live market positioning, which cuts down on surprises and protects capital on every trade.
See It in Action
A focused pre-trade OI scan takes under 90 seconds. Here is how experienced traders read strikewise open interest before every session.
Start Your TrialChoose your index (Nifty, BankNifty or FinNifty) or one of the 191 F&O stocks and select your expiry date. For intraday sessions, start with the nearest weekly expiry. Add a monthly expiry if you are trading a positional setup or want to compare how OI is distributed across time frames.
On the strikewise OI chart, identify the Call OI bar that stands tallest. That strike is your resistance for the session. Then find the tallest Put OI bar, which is your support. These two strikes form the range the market is most likely to respect, and they give you precise, money-backed levels for your strike selection and stop-loss placement.
As the index moves toward a high-OI strike, monitor whether OI at that strike is stable or declining. Stable OI means writers are defending, so expect a reversal. Rapidly declining OI at the resistance strike means writers are exiting and a breakout is building. This real-time OI reading gives you a heads-up before the price candle closes above the level.
Use Stolo's price and OI overlay chart to confirm that OI build-up aligns with the price trend. When price is rising and Put OI at lower strikes is increasing simultaneously, the bullish move has institutional backing. When both lines diverge, say price rising but Call OI spiking heavily, the ceiling is being reinforced and a reversal may be near. Cross-referencing these two views before executing prevents entering into a level that is actively defended against you.
Both tools show open interest data, but strikewise OI is purpose-built for the one task that matters most: reading support and resistance fast.
| Feature | Stolo Strikewise OI | Standard Option Chain | Generic OI Chart |
|---|---|---|---|
| Visual bar chart by strike | |||
| Separate CE and PE OI charts | |||
| Price and OI overlay on one chart | |||
| Up to 15 custom strikes from ATM | |||
| Up to 3 expiry dates | |||
| 191 NSE F&O stocks | |||
| NSE-authorised real-time data | Varies by broker | Varies |
Strikewise OI converts the raw options market data into a map of where the real money is positioned, giving traders an edge that price charts alone cannot provide.

Build high-probability F&O strategies around real OI data. Sell options at high-OI resistance strikes for premium collection, buy directional options at low-OI strikes ahead of breakouts, or construct spreads between key support and resistance levels identified by strikewise OI data.

Pinpoint OI-backed support and resistance in Nifty, BankNifty, and 191 NSE F&O stocks with clarity. Strikes where Put OI clusters act as floors and Call OI clusters act as ceilings give you levels the entire market is watching and defending.

Read NSE market participant positioning in real time and see where the largest bets are placed strike-by-strike, giving you institutional-grade F&O intelligence without needing a Bloomberg terminal or a proprietary data feed.
Questions?
Direct answers to the most-searched questions about strikewise open interest and strike-level OI analysis
Identify real support & resistance levels in Nifty, BankNifty & F&O stocks using strike-by-strike open interest data from NSE-authorised real-time feeds, on Stolo, India's most comprehensive Options Trading Platform.
Trader Voices
Every trade is a small bet on a dream, backed by risk and a decision you have to own. Stolo is built for traders who bring purpose and discipline to that decision, not just numbers.

My first impression of your site, "K.I.S.S."..... Simple yet effective...uncluttered and has all the ingredients a trader actually needs not the nonsensical ones... great job
These are unedited testimonials from traders in our Telegram community. Photos shown are AI-generated and used for representation only.

You have something unique in your platform that has changed my trading. I have used Quantsapp earlier didn't find it useful. I have tried opstra, sensibull etc.
These are unedited testimonials from traders in our Telegram community. Photos shown are AI-generated and used for representation only.

Dear Sir, I am really impressed with the user interface and multiple other facilities for option traders.
These are unedited testimonials from traders in our Telegram community. Photos shown are AI-generated and used for representation only.
Got a question or a feature you wish existed? Drop it in our Telegram community, the Stolo team is right there reading every message.