Trader Voices
Why Smart Traders Choose Stolo?
Every trade is a small bet on a dream, backed by risk and a decision you have to own. Stolo is built for traders who bring purpose and discipline to that decision, not just numbers.
Track PCR ratio live for Nifty and Bank Nifty with strike-wise breakdowns and OI cross-reference in one dashboard. India's most complete put call ratio live NSE tool, built so every trader beginner or pro, can read options sentiment the moment it shifts and act with clarity, not guesswork.
No credit card required · Trial Plan available · Setup in 3 minutes
Most F&O traders enter positions without knowing where options writers, the real money in this market, are actually positioned. Fragmented, delayed PCR data leaves you reacting to the market instead of reading it.
NSE updates its option chain on a lag. By the time you read PCR on most platforms, the sentiment shift has already played out and the trade window has closed.
Bank Nifty PCR, Nifty PCR, and stock-level PCR live across different tabs, tools, and websites. There is no easy way to compare them or lay them over price in one place.
A PCR of 1.2 looks bullish on its own, but is that high or low compared to the past week? Without that historical context, a single PCR reading tells you almost nothing.
PCR only really earns its keep when you combine it with open interest changes and price action. No standard platform connects all three, so traders end up piecing it together by hand.
Put Call Ratio (PCR) is one of the most widely tracked sentiment indicators in the Indian options market. It measures the volume or open interest of put options against call options for a given index or stock, giving you a real-time read on which way the market is leaning directionally.
When PCR sits above 1, more puts are being written or bought than calls, which usually points to bearish hedging or bullish put-writing conviction. When it falls below 1, call-side activity is running the show. Watching it live rather than at end of day is what lets you catch sentiment shifts as they're forming and trade with the flow of smart money instead of against it.
Explore OI Analysis on StoloRatio of put volume to call volume traded intraday. It reflects live trader activity and shifts fast, which makes it good for catching sudden intraday mood swings.
Ratio of total put open interest to call OI. This one moves more slowly and shows the positional bets that have built up over days or weeks, mostly from larger players.
Focuses only on out-of-the-money strikes. It filters out the noise from deep ITM positions, giving a cleaner read on directional hedging, especially useful in expiry week.
Bank Nifty carries higher volatility and its own PCR behaviour, driven by FII hedging and banking sector news. Its ratio swings harder and faster than Nifty's, so track it on its own terms.
Stolo brings live PCR data, historical context, strike-wise breakdowns, and OI analysis into a single trader-first dashboard, so there's no juggling between NSE, broker tools, and screeners.
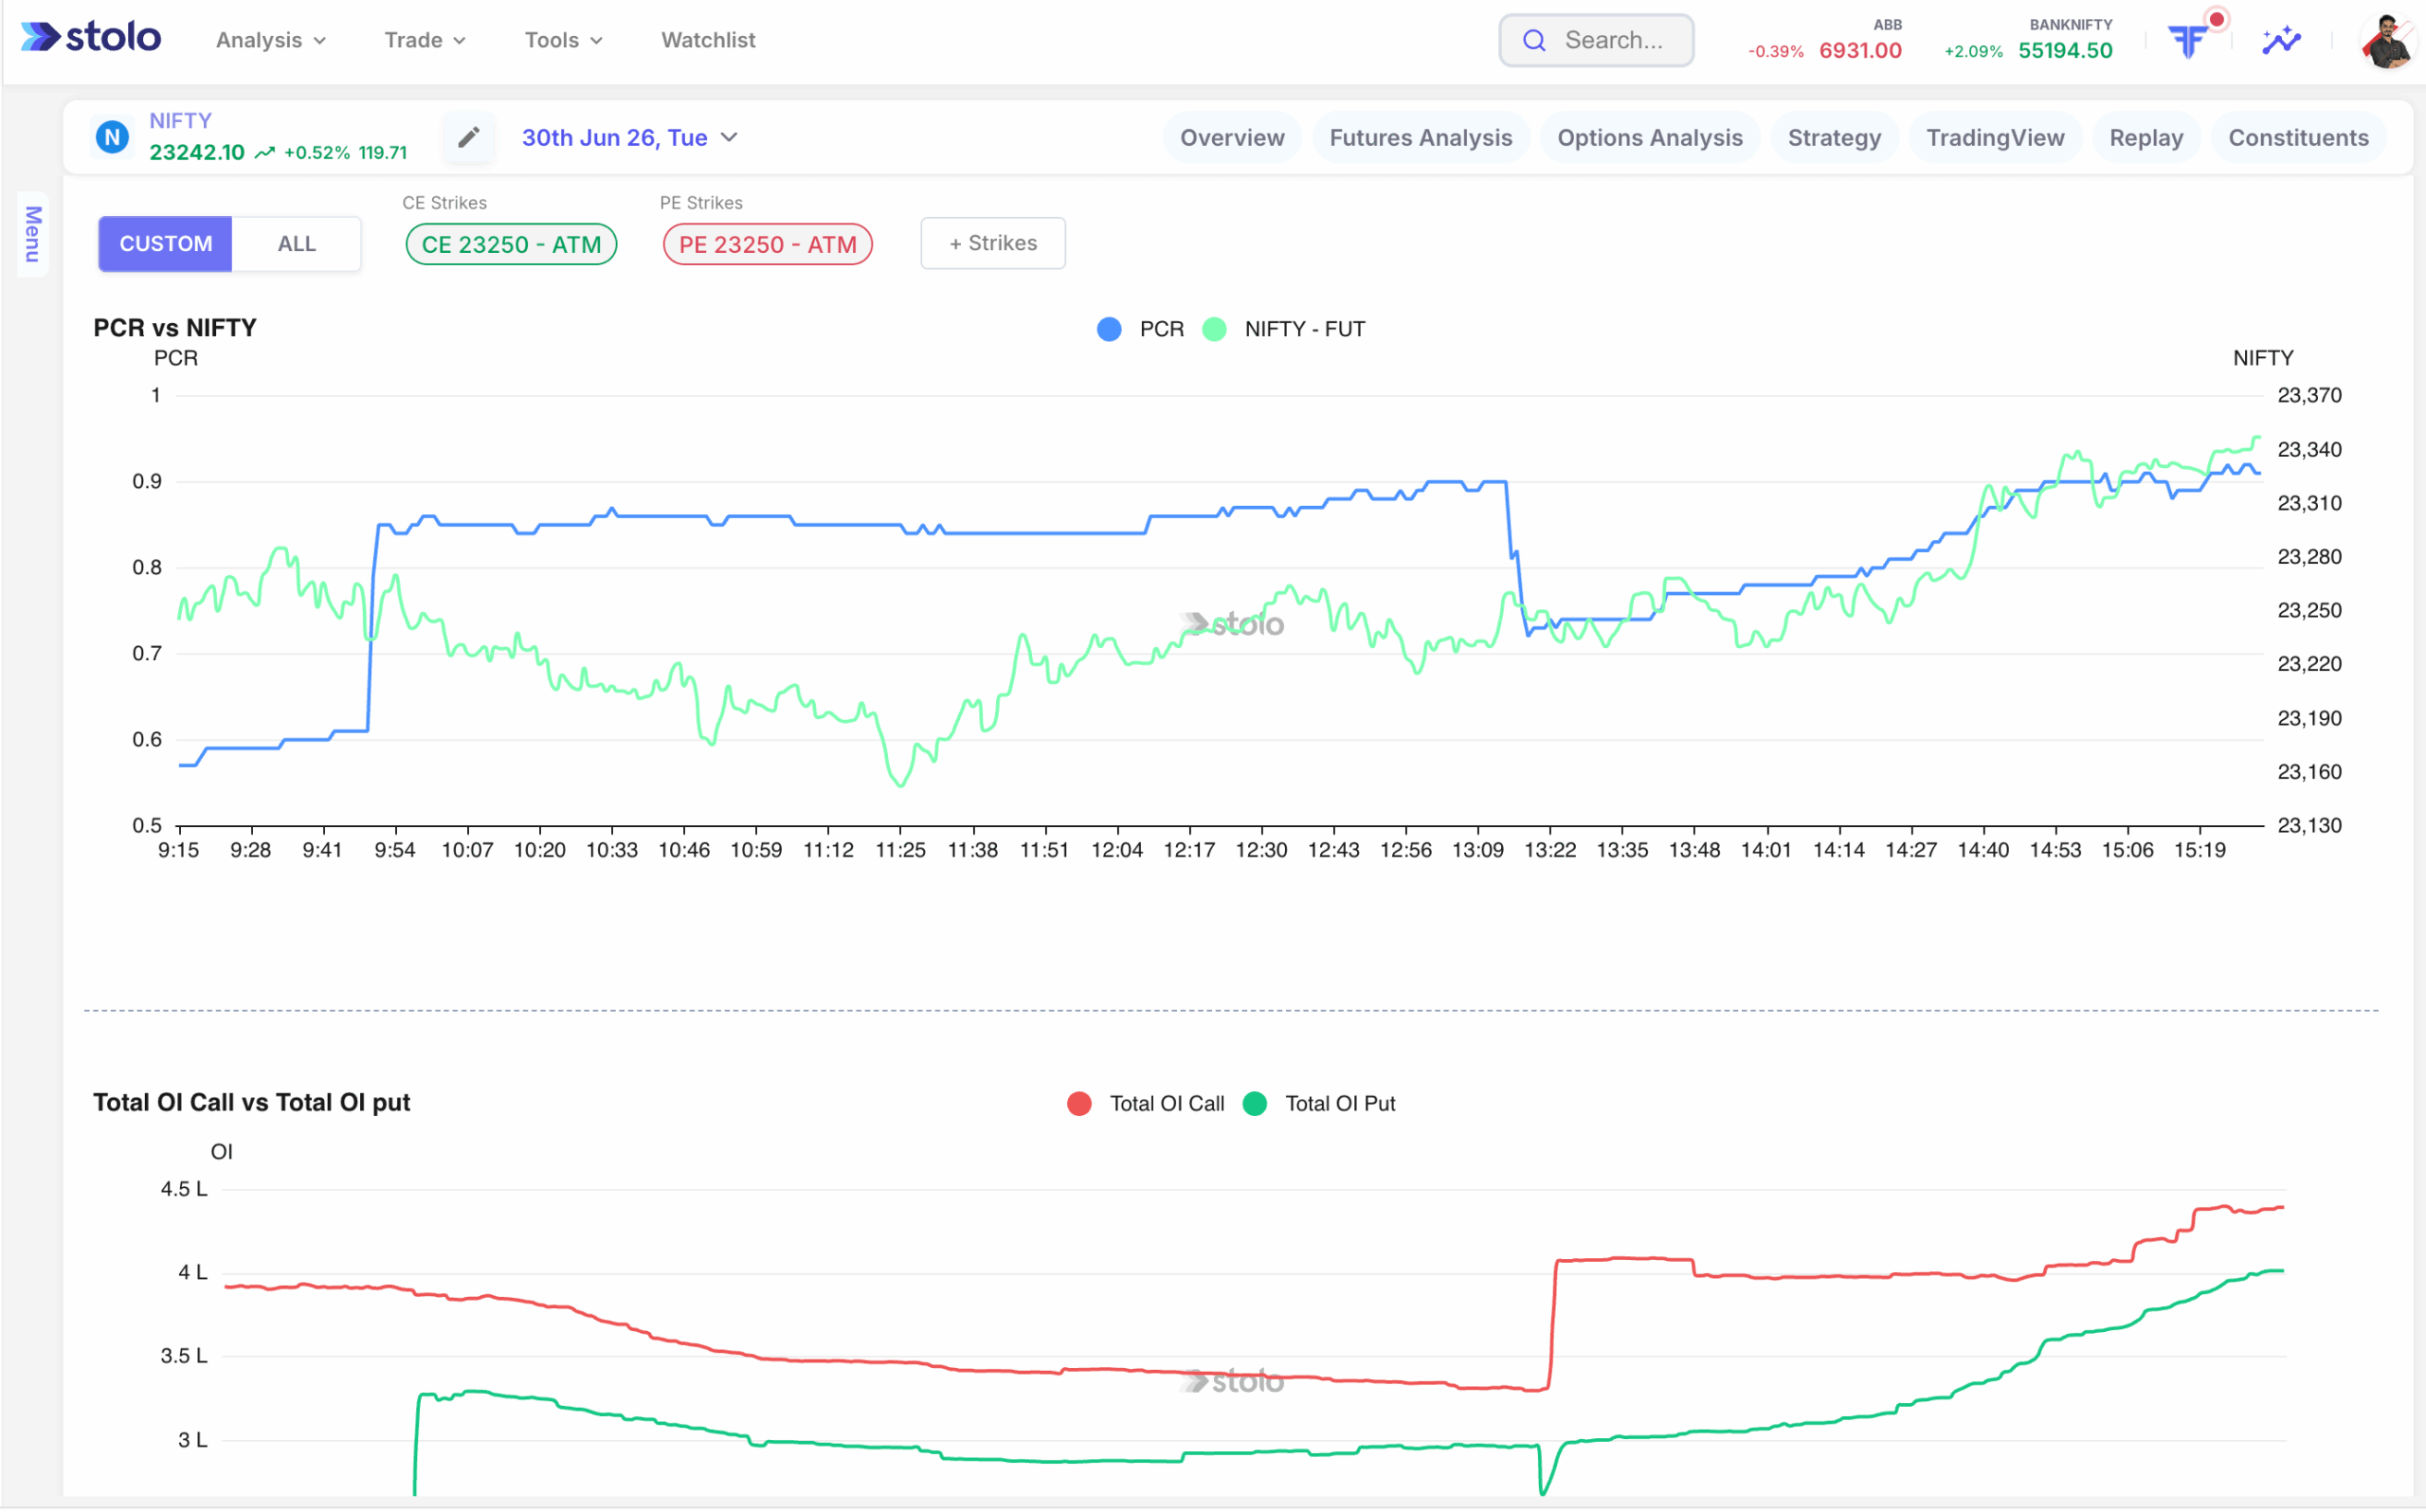
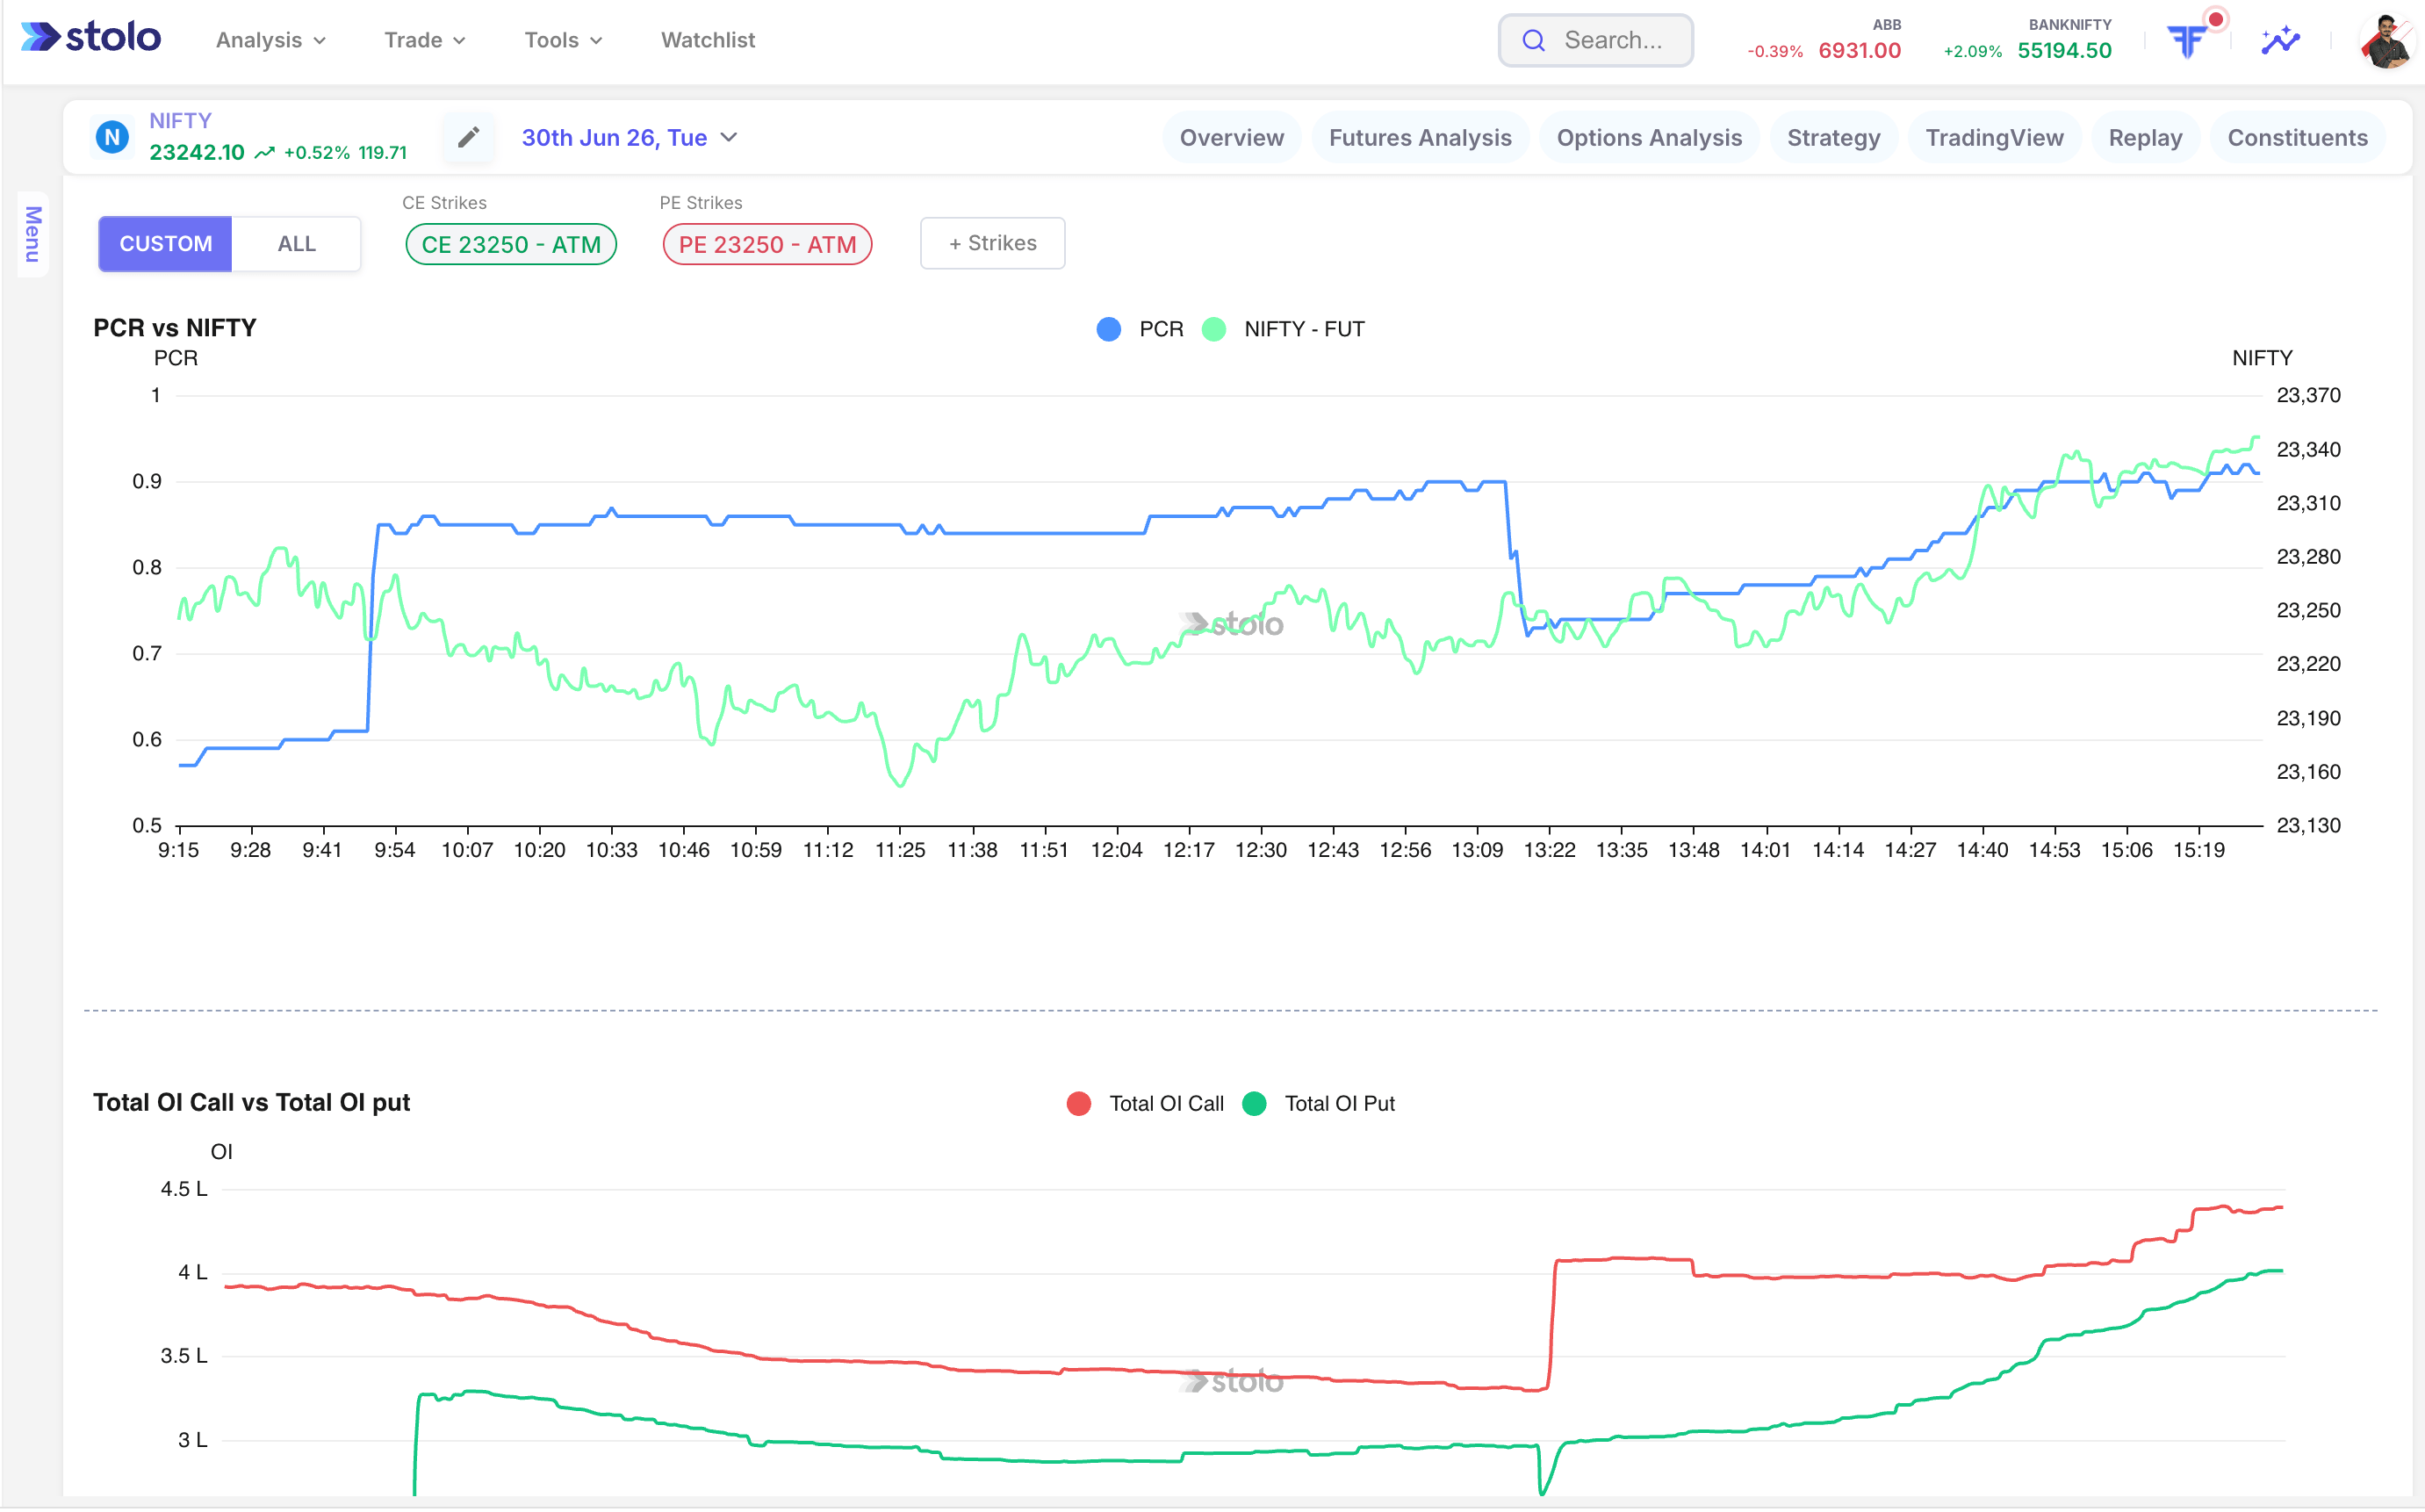
Stolo's PCR OI Trend chart draws the put call ratio live as a continuous intraday line, laid over the Nifty Futures price on a dual axis. You can see exactly how PCR moves against price in real time: PCR spiking while price rallies confirms the bullish read, while the two moving apart signals a reversal forming. A timestamp tells you how fresh the data is, and there's no manual refresh needed.
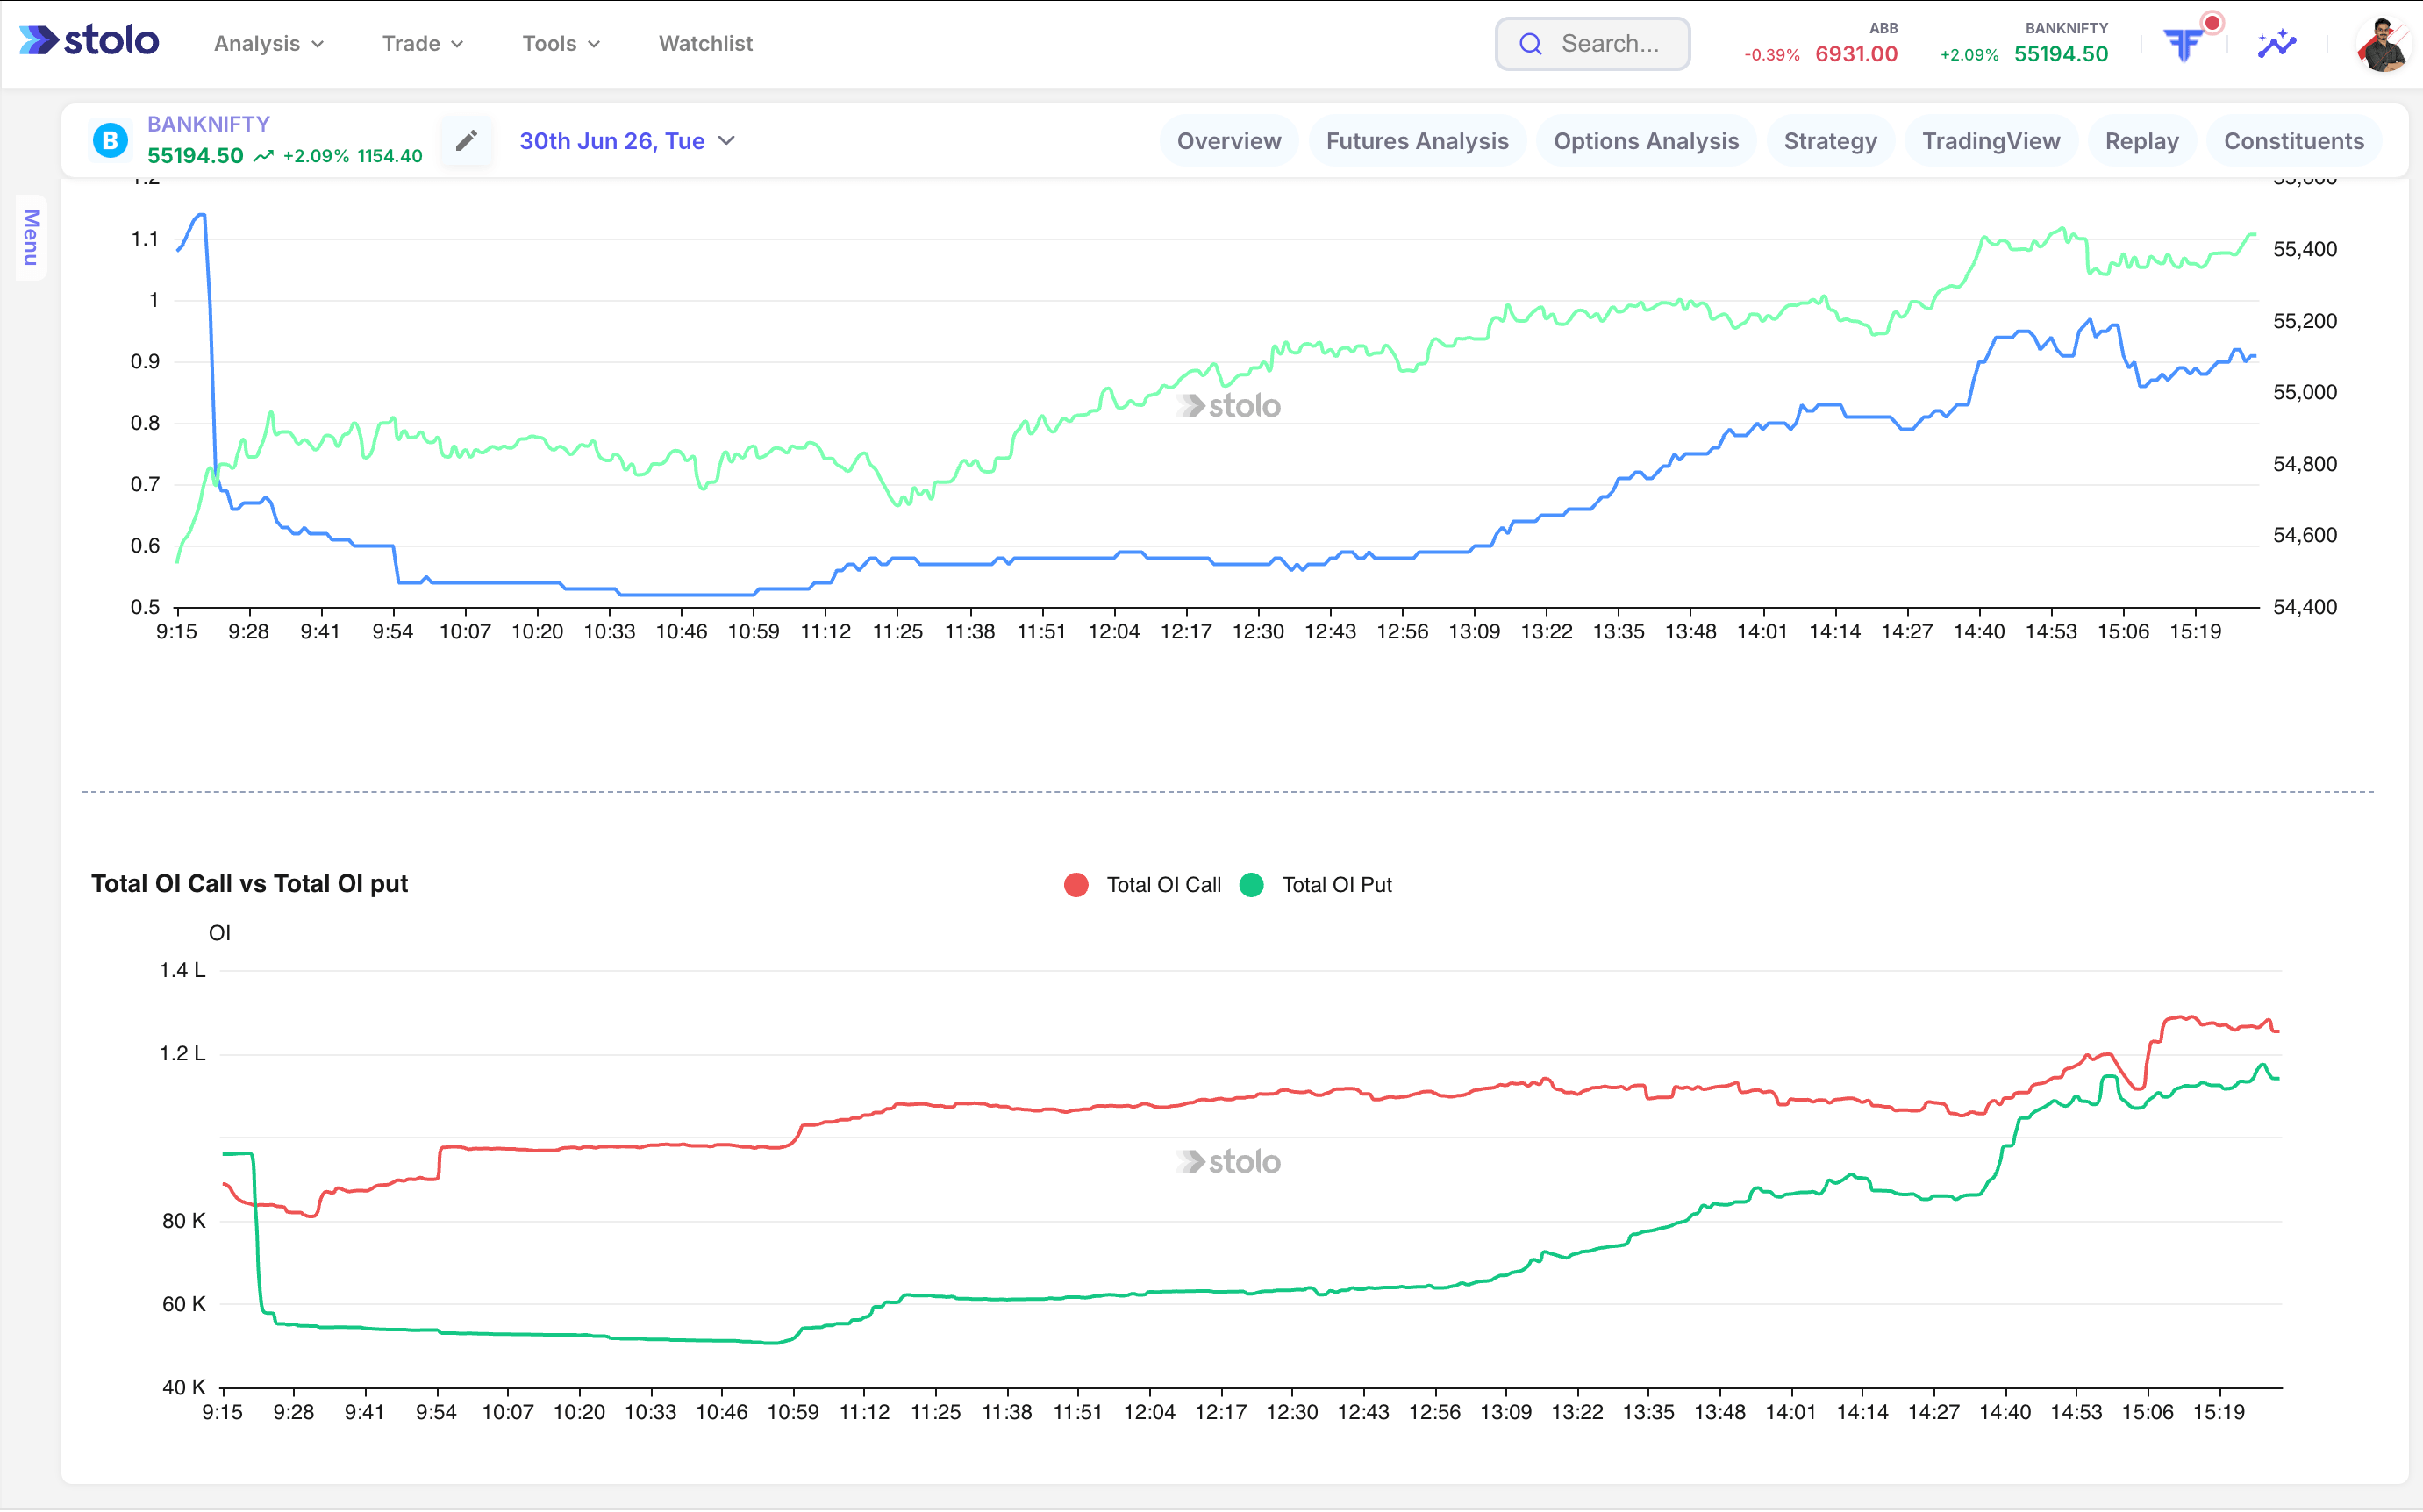
Bank Nifty's options market runs on its own PCR dynamics, shaped by FII hedging and banking sector volatility. Stolo gives it a dedicated PCR OI Trend chart instead of folding it into a Nifty composite, so you can watch BN-specific sentiment in real time, laid over Bank Nifty Futures price, and react before the shift fully plays out in the underlying.
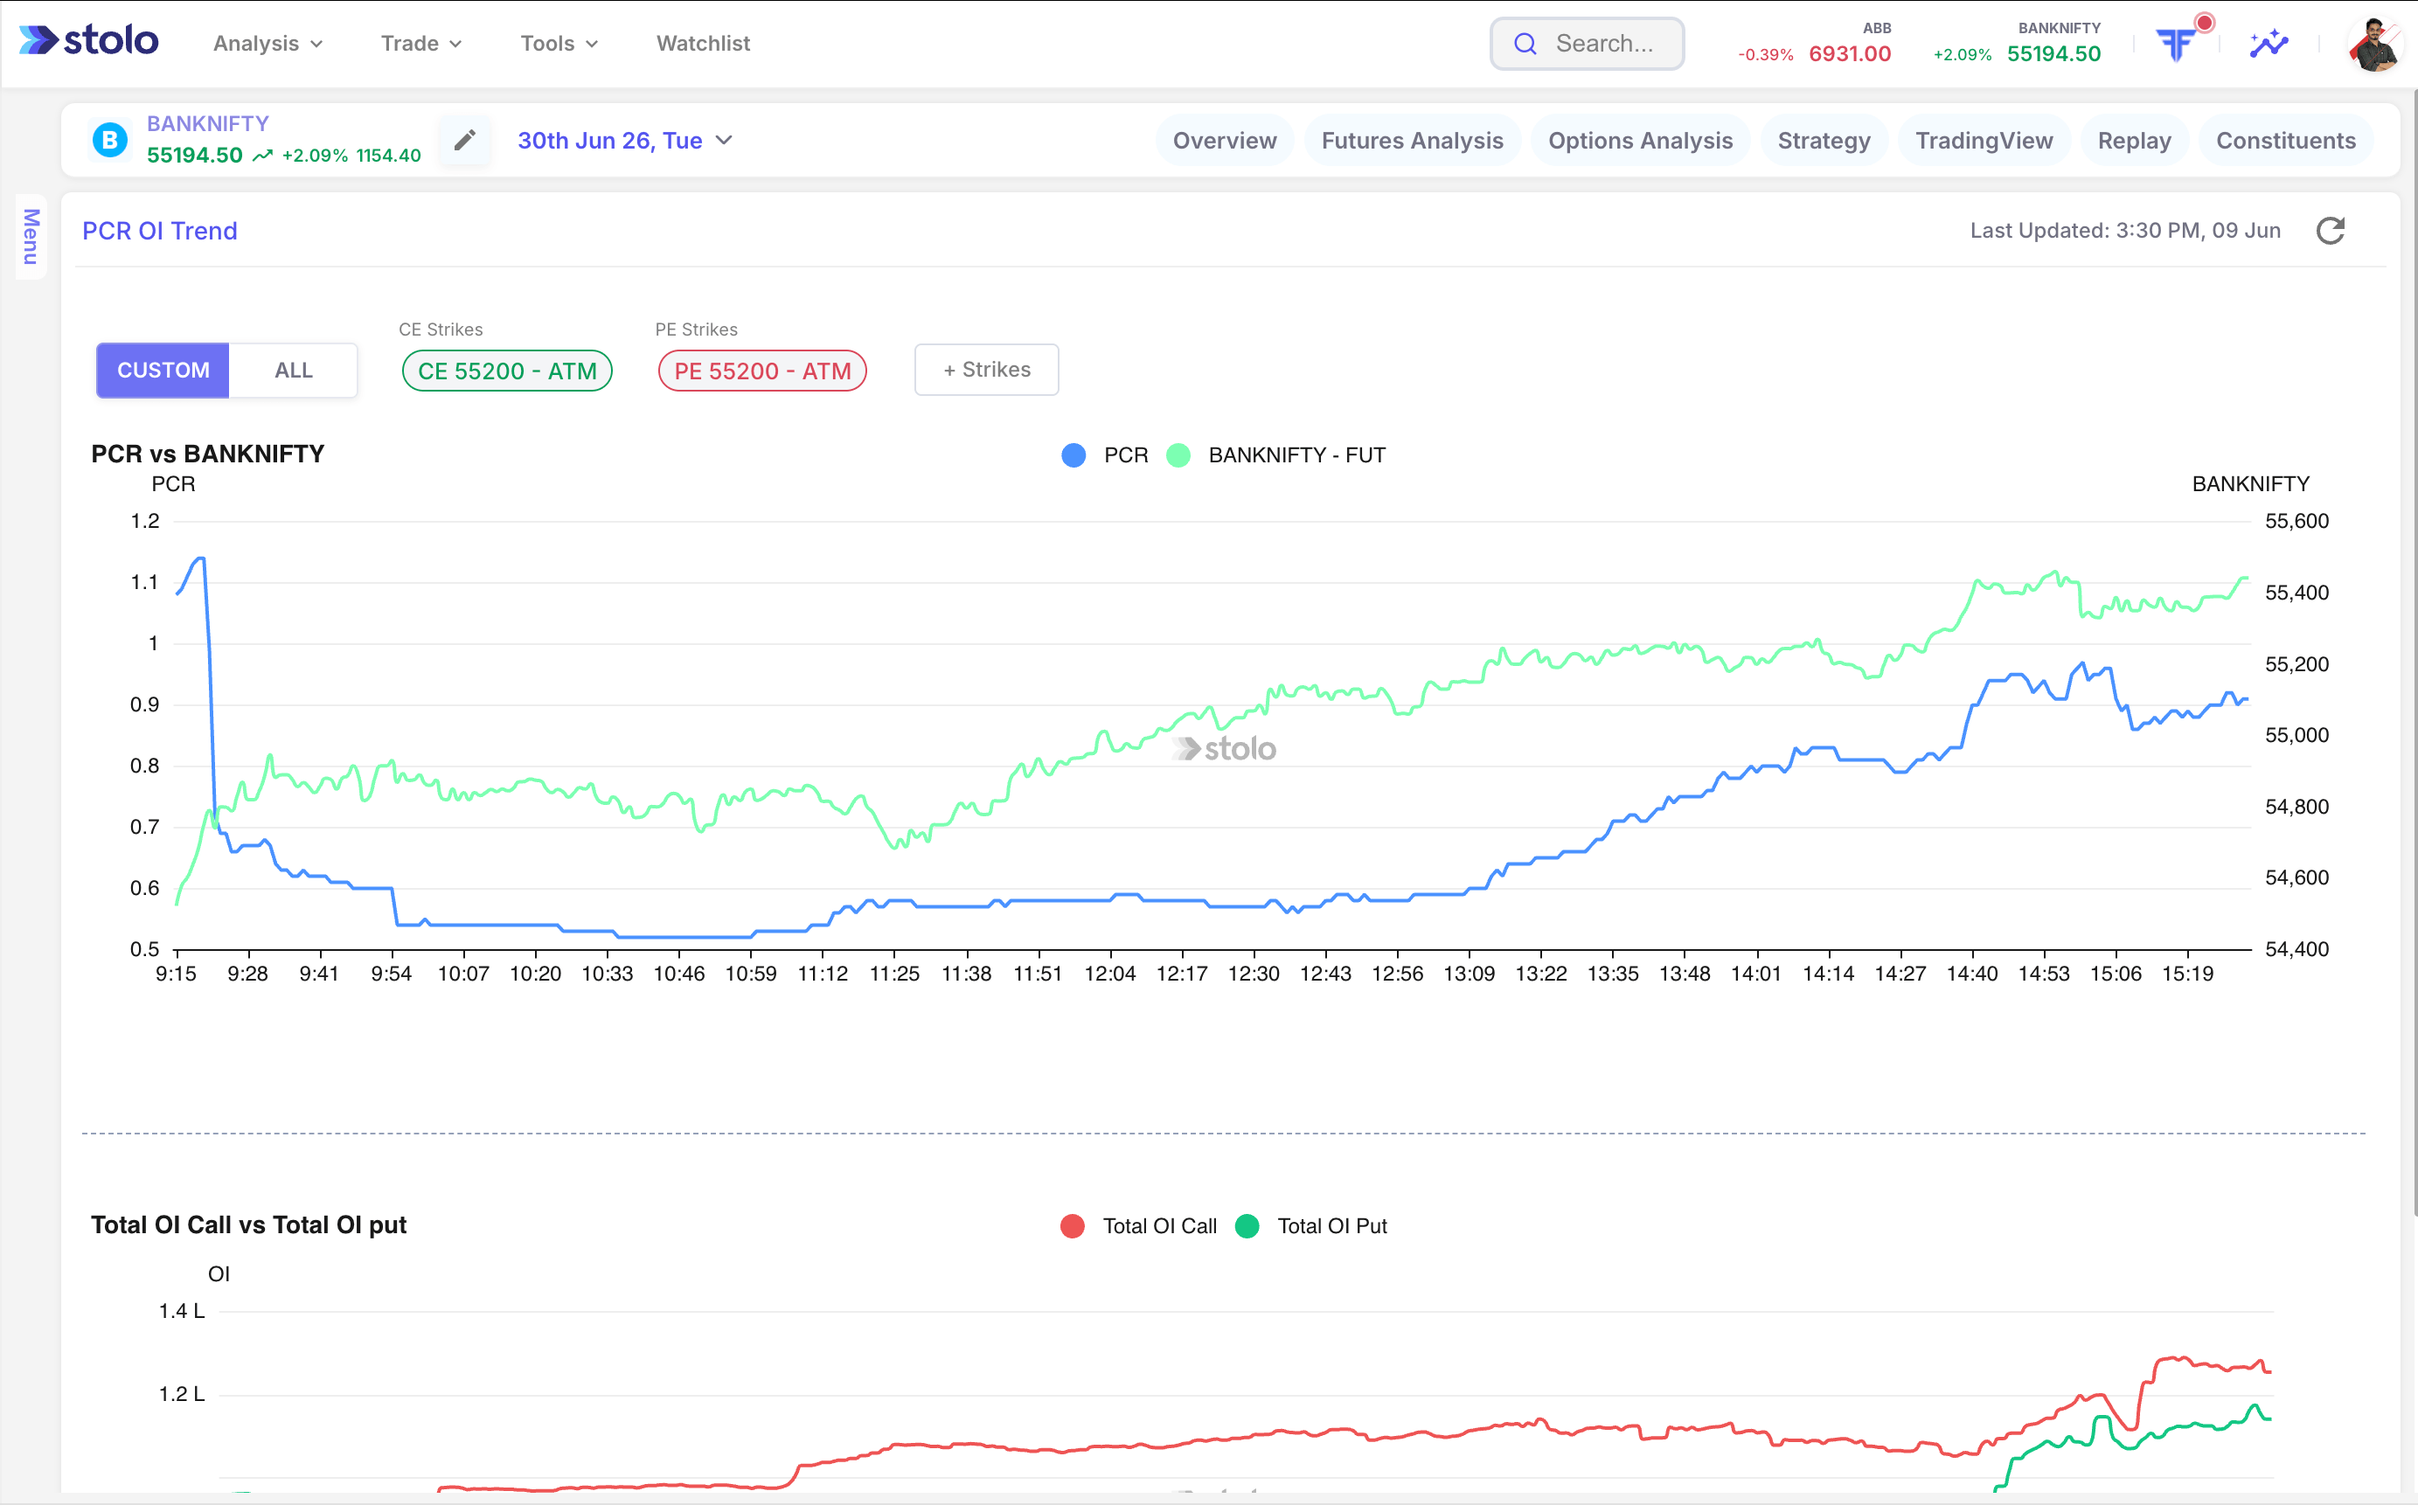
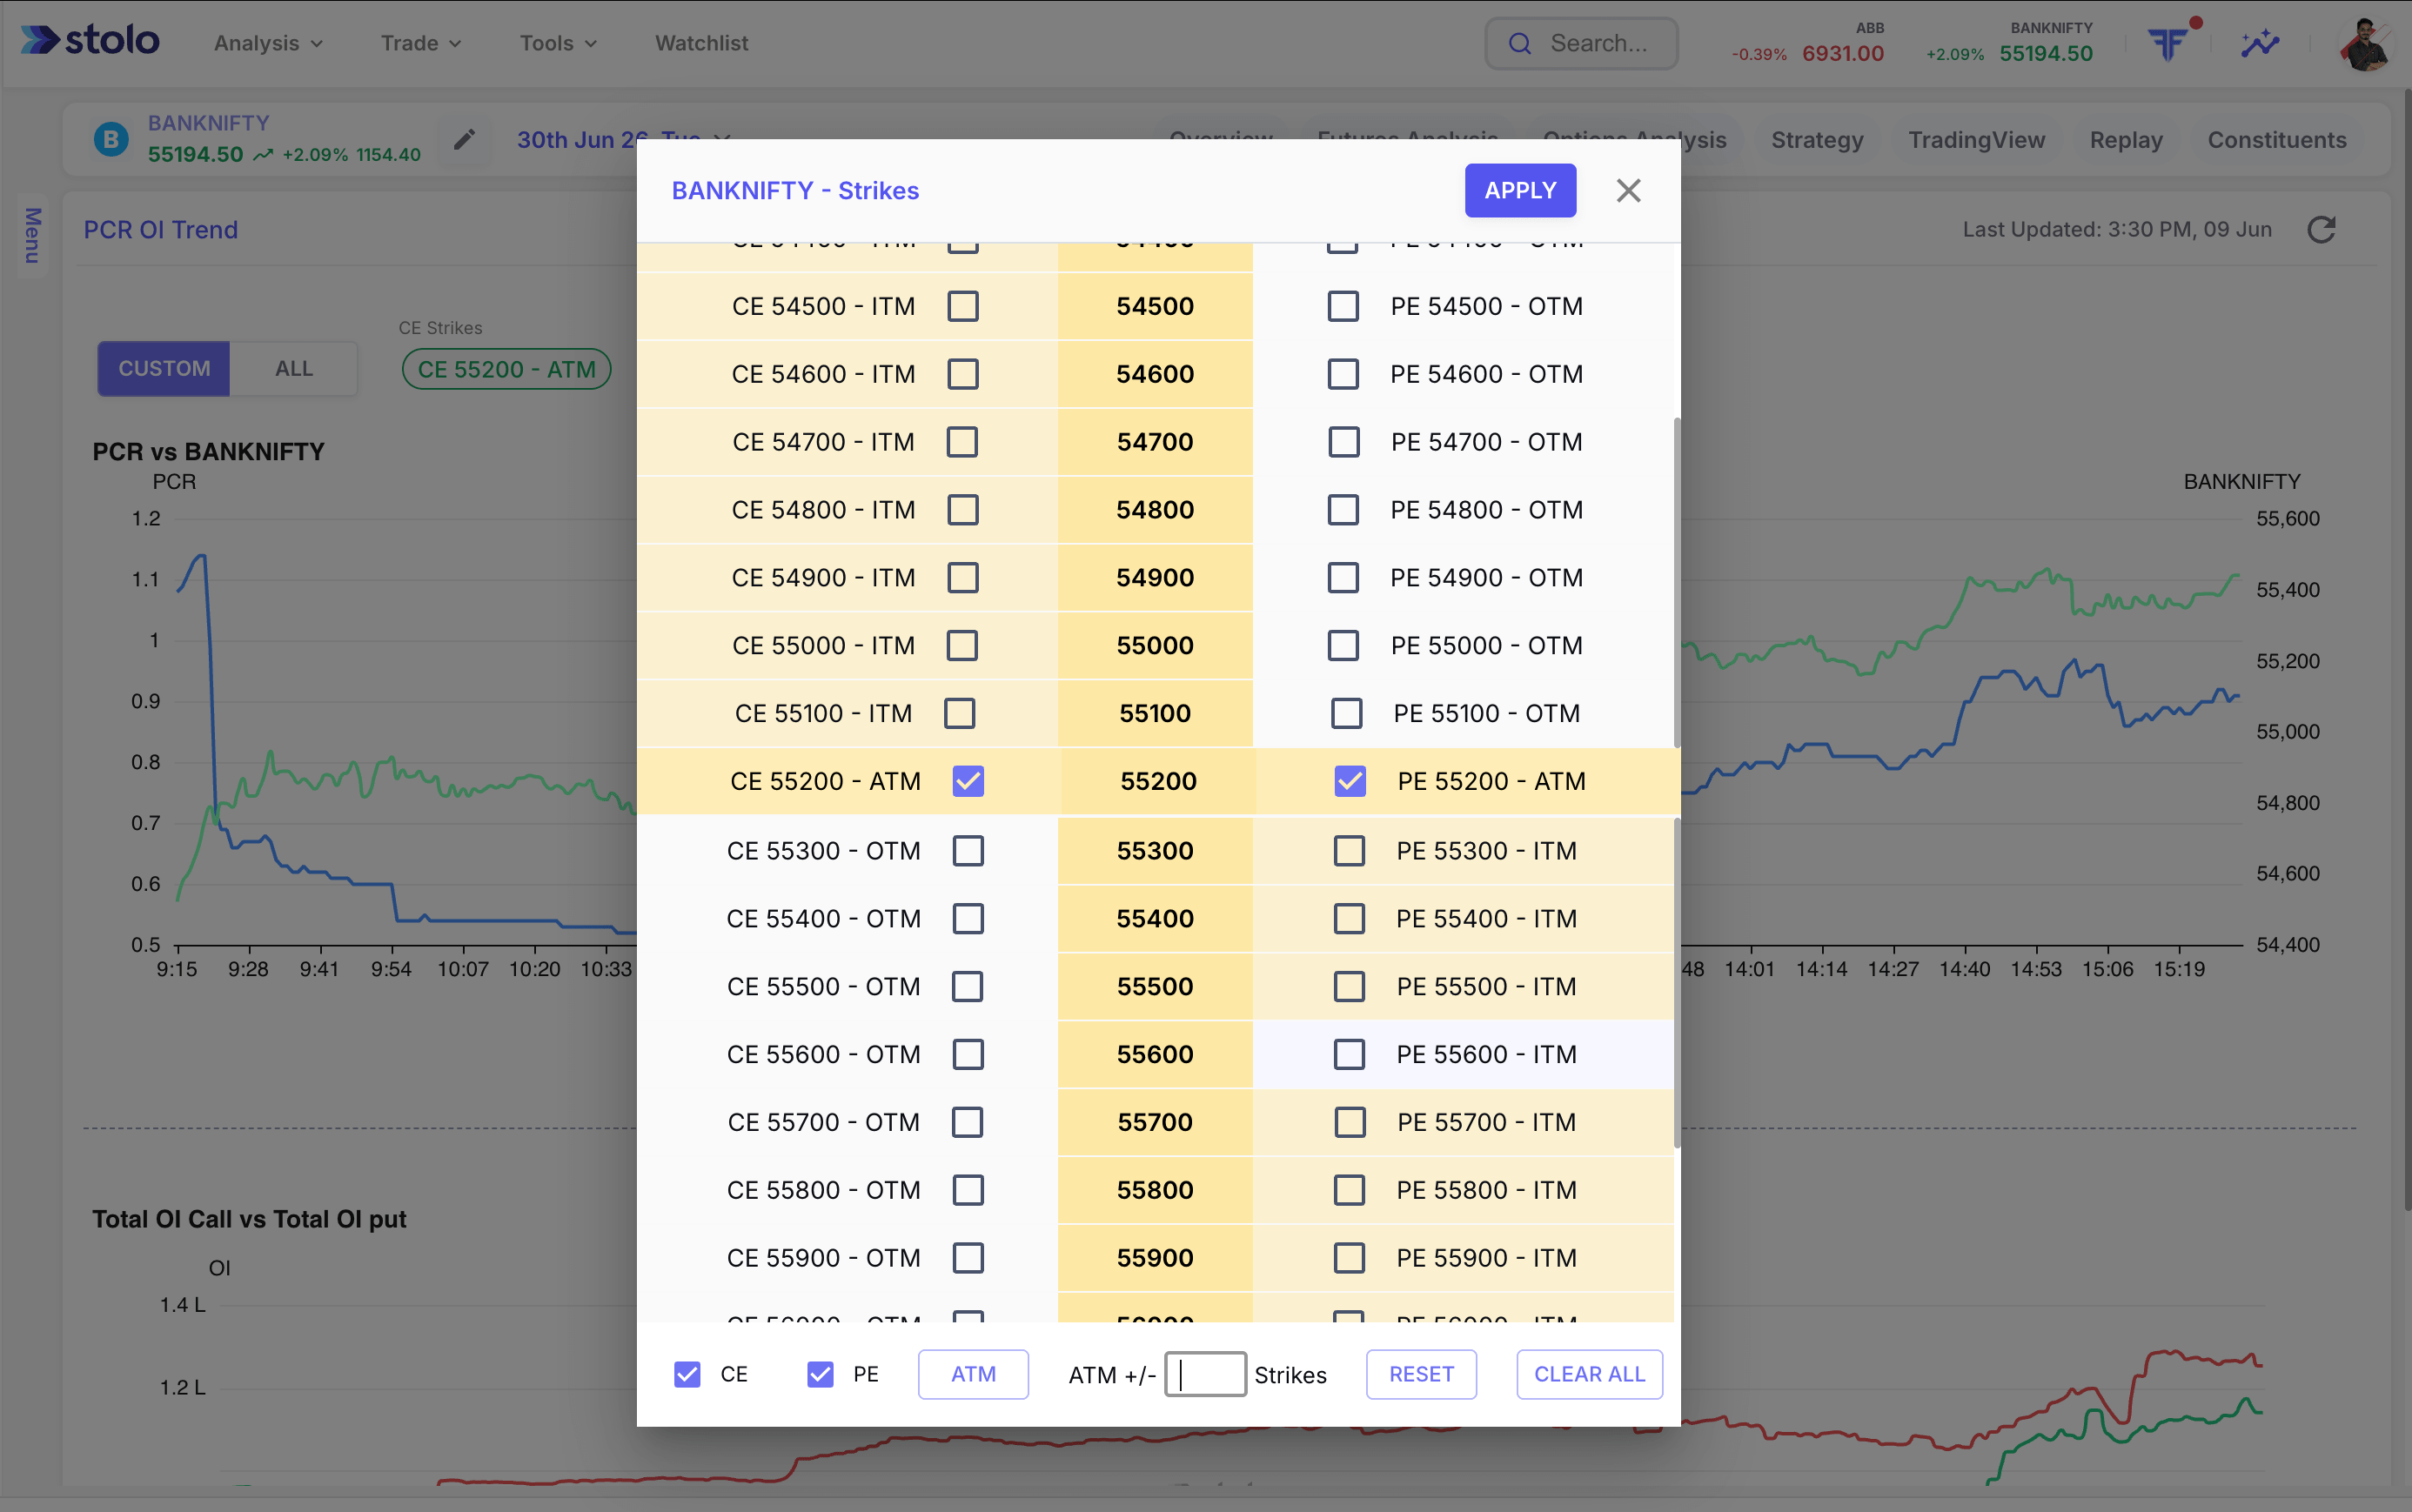
Stolo's PCR OI Trend isn't locked to one aggregate view. You choose which strikes drive the calculation, picking your CE strike and PE strike independently, setting each to ATM or any specific level, and flipping between CUSTOM and ALL modes instantly. That means you can isolate the PCR for just the strikes you're actually trading, cutting out noise from deep ITM or far OTM contracts that have nothing to do with your position.
PCR itself is a derived number. Stolo also shows you the raw source behind it: a live chart of Total OI Call (red line) against Total OI Put (green line), plotted from 9:15 AM to 3:30 PM. Call OI sitting well above put OI all session naturally suppresses the PCR reading. And when both lines converge sharply near the close, which happens on expiry days, that convergence points to large-scale position closing and calls for real caution on anything still open.
The aggregate PCR gives you the overall lean, but strike-wise PCR tells you which levels options writers are actually defending. Stolo maps the put-to-call OI ratio at every active strike, exposing the implied support and resistance floors the market is pricing in. When price gets close to a heavy put-writing strike while the overall PCR is also bullish, that confluence is a strong signal and the risk-reward on long positions improves noticeably.
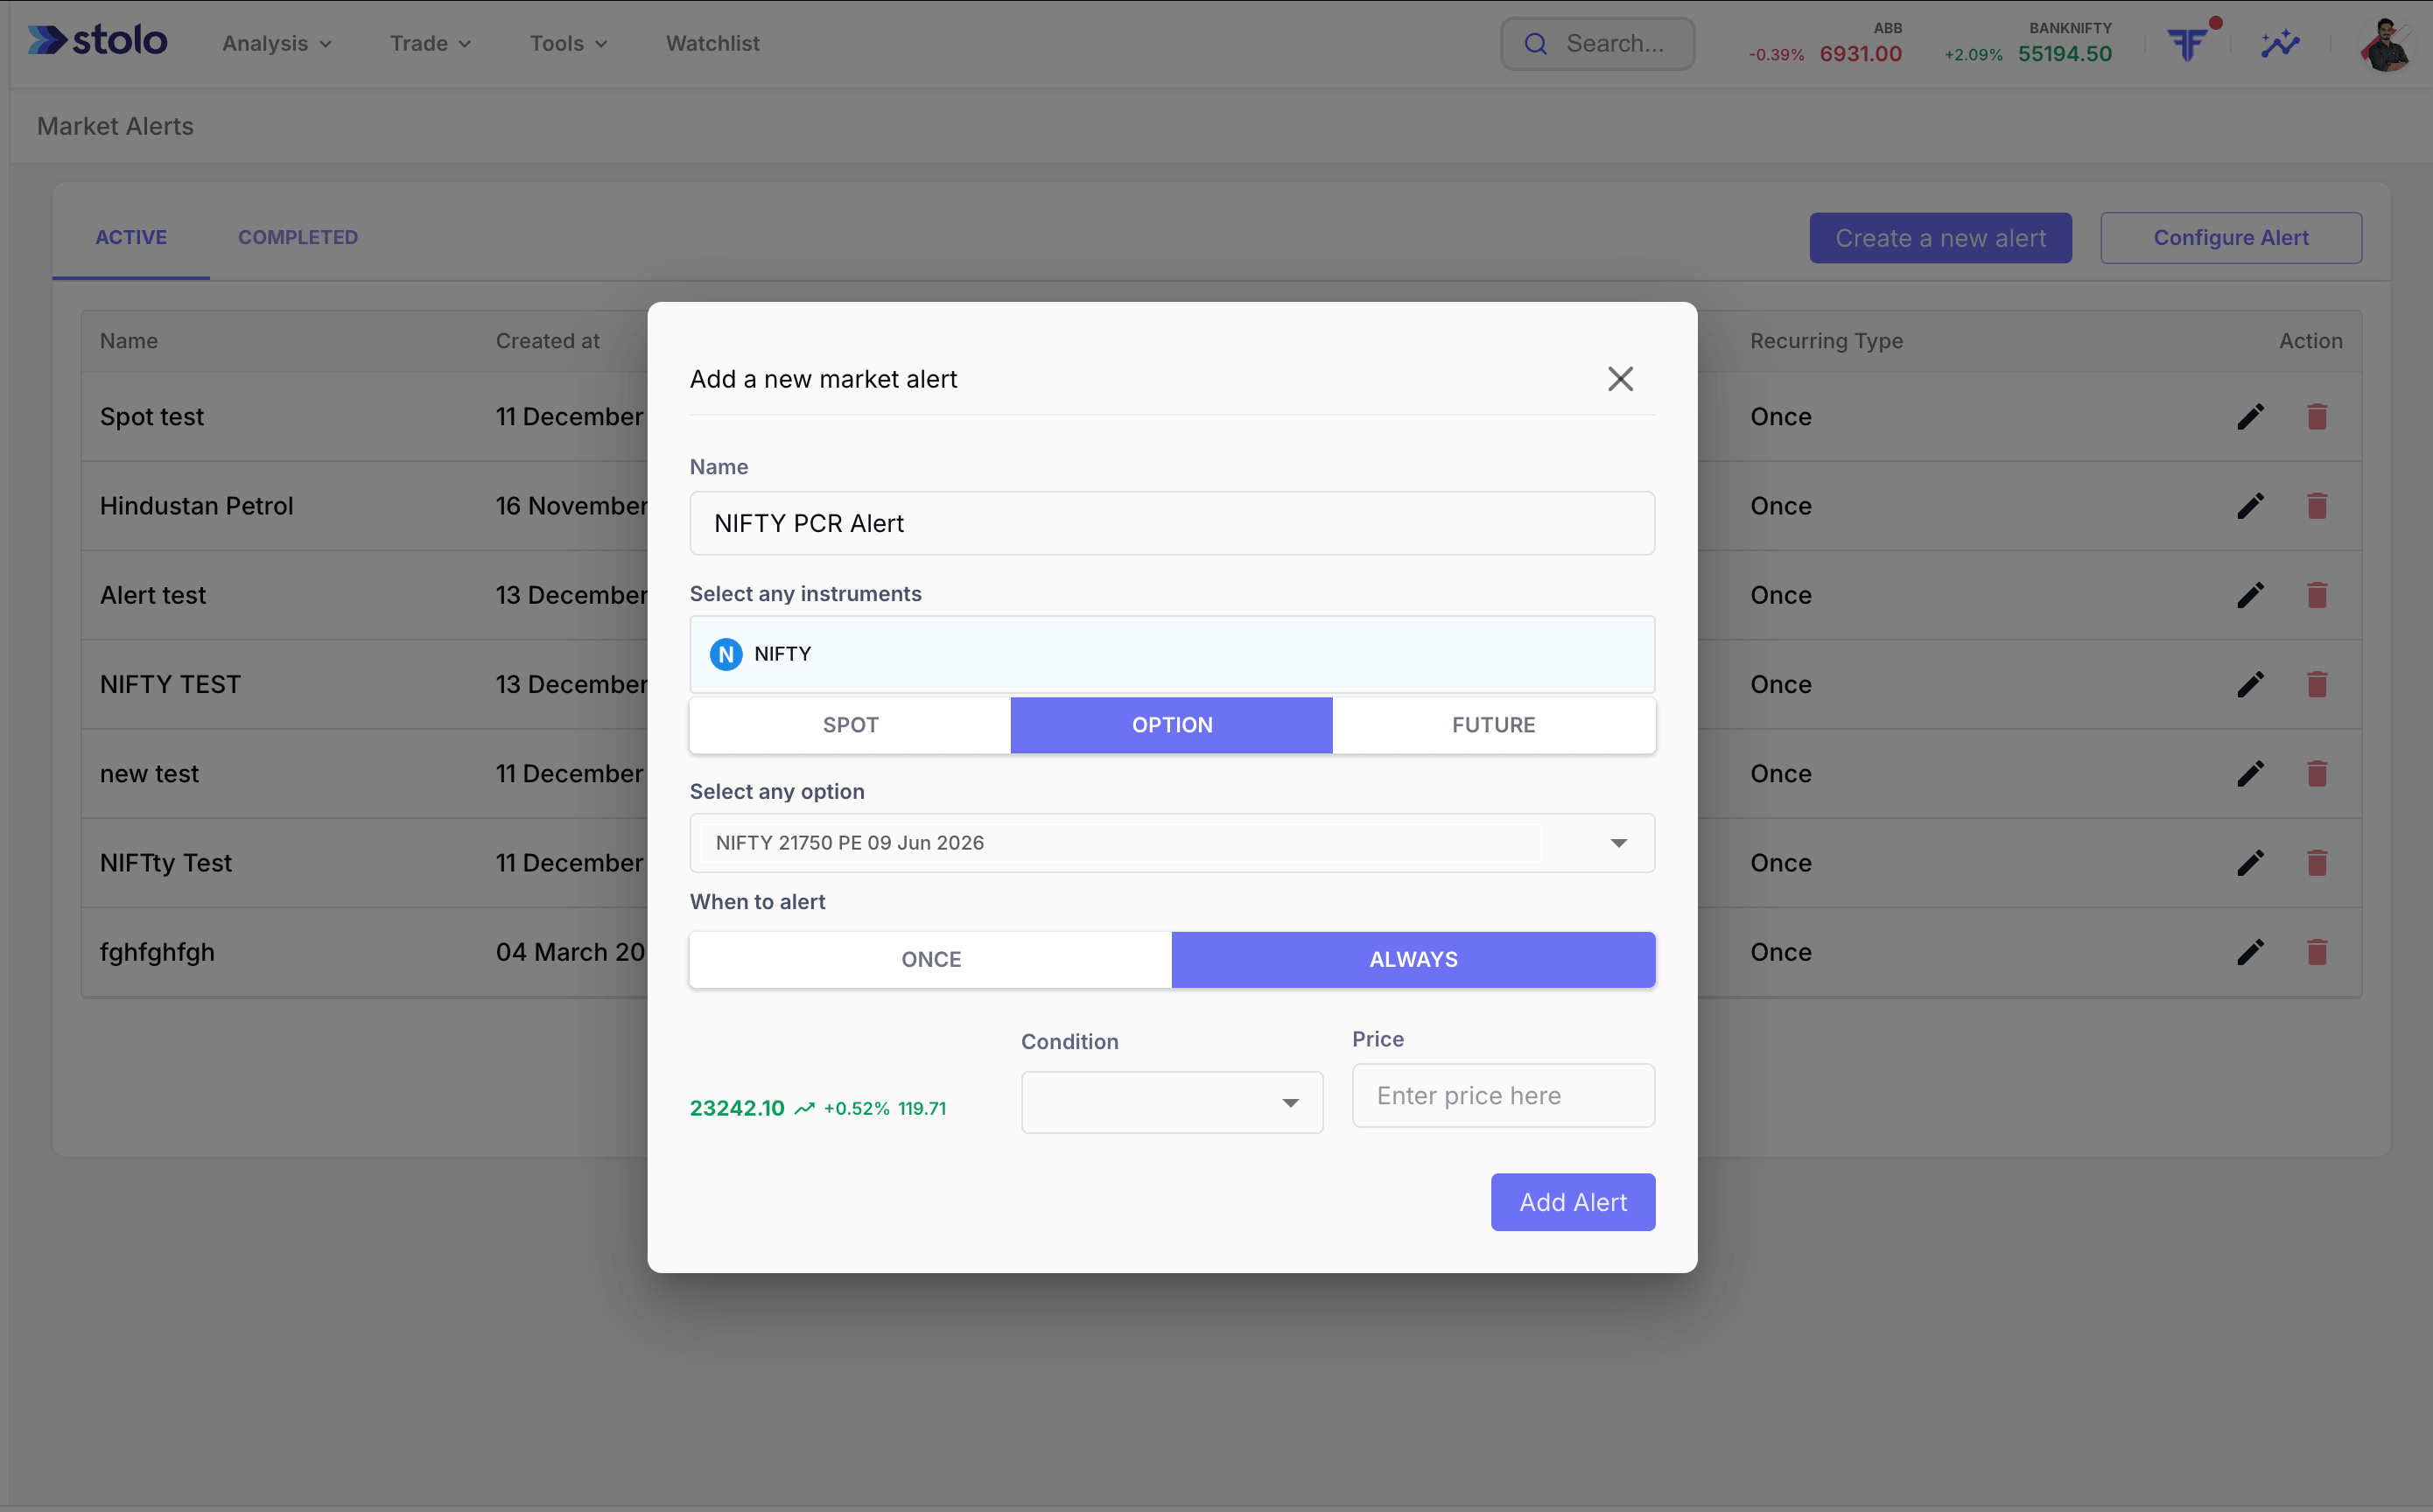
Nobody can watch a screen all day. Stolo lets you set custom PCR threshold alerts for any index or stock, so when Bank Nifty PCR drops below 0.8, or Nifty PCR crosses 1.5, you get a push notification right away. Set it once, trade with focus, and let the data come find you.
PCR works as both a confirming signal and a contrarian one, depending on where it sits. These four market states cover most of what shows up on the chart during a live session.
PCR jumping sharply, say from 0.3 to 1.8 within minutes, while the Nifty Futures line on the same chart also pushes to new session highs, is about as high-conviction a bullish read as you'll get. Put writers are moving fast, building or covering, and price is backing the move up. On Stolo's PCR OI Trend chart it's obvious: two lines climbing together. One of the cleanest go-long setups you'll see in options trading, worth sizing into with a trailing stop once it's confirmed.
PCR sitting suppressed between 0.2 and 0.4 for most of the session, which shows up on Stolo's Total OI Call vs OI Put chart as call OI running 3-4x above put OI, means the market is overwhelmingly long calls. Don't mistake that for bullish. It usually points to either retail overconfidence or institutional hedging against downside. Best to hold off adding fresh long calls here, and keep an eye on the Total OI Call line: a sharp drop means writers are heading for the exit and a reversal could be close behind.
The riskiest scenario on Stolo's PCR OI Trend chart is PCR rising while price refuses to follow, or price hitting a new high while PCR falls. That gap means positioning and price aren't telling the same story. Whatever your experience level, this is the moment to cut size, widen stops, and wait for the two to line up again before adding. The dual-axis view makes this divergence jump out immediately, something a bare PCR number would never show you.
On expiry days, Stolo's Total OI Call vs OI Put chart often shows both lines rushing toward each other in the final 30-45 minutes as writers close out en masse. Watch for the red and green OI lines closing the gap after 14:30. It signals real positioning risk for anyone still holding options, and closing or hedging before liquidity dries up in those final minutes is the sensible move regardless of how experienced you are.
PCR does its best work as a filter, not a trigger. Professionals lean on it to confirm a bias they already have, rather than using it alone to start a trade. Here's the workflow, whether you're building good habits from scratch or sharpening an edge you already have.
Start TrialLook at the previous session's closing PCR and overnight OI buildup on Stolo before 9:15 AM. That gives you a baseline for whether smart money is entering the session net bullish or net bearish heading into expiry week. If you're new to this, just track the number daily for a couple of weeks before you start trading off it.
Decide whether you're trading Nifty or Bank Nifty options and track each one's PCR on its own terms. Bank Nifty PCR can spike past 1.8 on a policy day while Nifty PCR barely twitches. Treat them as interchangeable and you'll end up with false signals, which is why Stolo keeps them separate so you're always looking at the right frame.
Open Stolo's PCR OI Trend view and watch the PCR line (blue) against the Nifty Futures line (green) on the dual-axis chart. A PCR that sat below 0.3 all morning and then spikes to 1.8 at 14:45, while Nifty breaks to new highs at the same time, is one of the strongest intraday signals the options market throws up. That story is obvious on the chart in a way a raw number could never manage.
Pull up the strike-wise PCR view to identify which strikes have the heaviest put writing. These levels act as implied support floors for the session. When price approaches a heavy put-writing zone while aggregate PCR is above 1.2, the confluence is strong and the risk-reward of long positions improves.
Before you enter or add to a position after 14:00, pull up Stolo's Total OI Call vs OI Put chart. Lines trending toward each other, call OI falling as put OI rises at the same time, means large writers are unwinding and the session is heading into expiry-close territory. Adding fresh positions into that setup raises your odds of getting caught in an illiquid reversal considerably. This chart gives you a 20-30 minute head start that a plain PCR number just can't.
Set a PCR alert on Stolo for your key levels, usually 0.8 on the bearish side and 1.4 on the bullish side for Nifty. When the live ratio crosses that threshold, you get a notification right away and can reassess without staring at the screen the whole session. Less screen time, better decisions.
Traders mix up PCR and OI often. They're related measures, but they're answering completely different questions about how the market is positioned.
PCR measures put activity against call activity, and it answers one question: is the options market leaning bullish or bearish right now? A rising PCR means put positioning is growing relative to calls, often a sign that money is either hedging a long book (bullish) or building outright bearish bets.
OI measures the total number of outstanding contracts, telling you how much capital is committed and at which strikes. OI rising alongside price signals conviction behind the move; OI rising against price can mean a trapped position about to unwind. It answers how much, not which way.
The Stolo edge: Stolo is the only platform showing live PCR and OI change together in one combined view, so you see both the direction and the conviction behind every market move without switching tools.
Explore PCR & OI on StoloNot all PCR tools are built for traders. Here is how Stolo compares against the places most traders currently look for this data.
| Feature | Stolo | NSE Website | MoneyControl | Broker Platforms |
|---|---|---|---|---|
| Live PCR (auto-refreshed) | Delayed | Delayed | ||
| Dedicated Bank Nifty PCR panel | Manual calc | |||
| PCR history chart (30-day) | ||||
| Strike-wise PCR breakdown | OI only | |||
| PCR + OI combined view | ||||
| Custom PCR threshold alerts | Price only | |||
| F&O stock PCR (191 stocks) | Manual | |||
| NSE-authorised data feed | Scraped | Varies | ||
| Beginner-friendly context and guides | Partial |
7-day trial · Full access to PCR tools from day one
Questions?
Direct answers to the most-searched questions about put call ratio live NSE, Bank Nifty PCR, and how to use PCR in your F&O trading
Trader Voices
Every trade is a small bet on a dream, backed by risk and a decision you have to own. Stolo is built for traders who bring purpose and discipline to that decision, not just numbers.

My first impression of your site, "K.I.S.S."..... Simple yet effective...uncluttered and has all the ingredients a trader actually needs not the nonsensical ones... great job
These are unedited testimonials from traders in our Telegram community. Photos shown are AI-generated and used for representation only.

You have something unique in your platform that has changed my trading. I have used Quantsapp earlier didn't find it useful. I have tried opstra, sensibull etc.
These are unedited testimonials from traders in our Telegram community. Photos shown are AI-generated and used for representation only.

Dear Sir, I am really impressed with the user interface and multiple other facilities for option traders.
These are unedited testimonials from traders in our Telegram community. Photos shown are AI-generated and used for representation only.
Got a question or a feature you wish existed? Drop it in our Telegram community, the Stolo team is right there reading every message.